Environmental consultant Alan Pears AM makes the case for energy efficiency and emissions ratings that better reflect the impacts of peak demand and seasonal variability.
Assessing, rating and regulating building energy use and emissions used to be simple when we were coming from a base of extremely inefficient buildings, the climate was not changing much, and flat electricity and gas tariffs were the norm.
We now live in a world where the carbon intensity and pricing of electricity varies both from hour to hour and seasonally. As we shift from fossil gas and our electricity supply system moves from heavy dependence on fossil fuels to variable renewables, matching demand to supply and limiting peak demand matters more.
Buildings are major contributors to peak electricity and gas demand in both summer and winter. On sunny days, electricity prices and emissions intensities drop around the middle of the day. At night and on cold and cloudy days, they increase.
This article makes the case for building design, rating and regulation to focus more on peak demand and seasonal energy consumption and emissions ratings.
Seasonal struggles
High peak electricity demand reduces the overall utilisation of fixed supply infrastructure and drives up capital costs. This is reflected in high fixed daily supply charges and peak demand charges, which can cause electricity bills to skyrocket. It may also lead to reduced supply reliability and surging spot market prices at times of high demand, just when people really feel they need energy.
Southern Australia – where coal generation is becoming less reliable – is a great example of this. Across the region, demand for direct use of gas and gas-fired electricity is much higher in cold winter weather than in other seasons. Sources such as openelectricity.org.au show that, during periods of multi-day high demand and low solar generation in winter, wholesale electricity prices in southern Australia increase. If you select the weekly electricity graph option, this is obvious.
AEMO’s Gas Statement of Opportunities report shows that across southern Australia, winter peak day gas and gas-fired electricity demand is much higher than summer demand. Much of this demand is driven by inefficient buildings being heated by inefficient gas and electric heating. As winter gas supply declines, shortages are becoming more likely and prices are increasing.
Summer peaks are typically briefer, and solar PV systems with energy storage can usually manage these well. Recently these peaks have been higher than winter peaks, which means networks must have greater capacity to cope with them, though the electrification of heating is increasing winter electricity peaks.
An expensive market design
Energy market data shows that dispatchable generators, gas and hydro, and battery operators exploit the poor design of the spot electricity market to bid high prices. Recent reports on RenewEconomy suggest battery owners charge even higher prices than gas generators – and all generators and storage operating in the spot market at that time are paid the highest-bid price, regardless of their generation costs.
They make windfall profits at the expense of consumers. And it’s legal.
In contrast, wholesale electricity prices can go negative in sunny weather, and “variable” renewable output from PV and wind may be curtailed during these times to stabilise prices so inflexible coal-fired clunkers can keep running. This market design allows coal generators to continue providing power during the evening peak, when usage is high but solar power drops off.
All these factors send a clear message: peak electricity and gas demand matters a lot more than it used to. If we electrify without managing peak electricity demand, we will pay a lot more for electricity at those times, especially when the sun is not shining.
On the other hand, if we can shift demand to sunny times, electricity should be cheap. Unfortunately, crude solutions that just shift demand to the middle of the day can add to our problems on cloudy, cold winter days. For example, shifting inefficient electric appliances, such as traditional resistive electric hot water systems, to daytime will help for a lot of the time, but add to problems in critical winter times. Simple time-based tariffs may mean many water heaters are fully charged by lunchtime on sunny days, so they may not help with afternoon “excess” solar.
All this means it’s becoming more important to reduce peak demand for building heating, cooling and other equipment that uses electricity at critical summer and winter times.
Peak demand in commercial buildings
Commercial buildings typically use more electricity at certain times:
- Early morning, especially on Mondays and in cold or hot weather, when buildings are heating up or cooling down after the weekend, cyclists are having showers and equipment is starting up for the working day
- Cold days, especially if it is cloudy and windy
- Summer afternoons, when the thermal inertia of buildings has delayed the need for cooling and morning cloud has “burned off”
- Evenings, when restaurants and entertainment venues provide services and food stores replenish refrigerated food
- Overnight, when many buildings’ electricity consumption was designed to make use of cheap coal-fired electricity.
At present, commercial building regulations and rating schemes focus on annual energy consumption and annual carbon emissions. This approach has delivered substantial benefits, but we need to move forward.
Complex calculations
Navigating tensions between minimising annual energy consumption and minimising peak demand can be extremely complicated, particularly in highly glazed commercial buildings that are full of both people and appliances.
Let’s consider “thermally leaky” buildings. In many Australian climates, ambient temperatures are moderate for much of the time. Under these conditions, having a thermally leaky building can actually reduce overall annual energy consumption; heat generated internally or from solar gains can just leak out of the building instead of requiring active cooling.
This sounds great, but unfortunately it’s not that simple. While these solar gains may also reduce heating requirements near some windows, other parts of the building may still need heating at the same time. When those solar gains are particularly high, they can increase peak cooling demand, create glare and reduce usable floor area.
In extreme weather, large amounts of heat can be gained or lost though a highly glazed, thermally poor building fabric. This means thermally poor buildings require larger capacity HVAC systems that use more energy at times when it may be more expensive, generate more emissions, or be in short supply. Large capacity systems may also operate at lower efficiency when running on low loads.
To put this in context, a high-performance window can transmit over 100 watts/m2/C°, but that is only equivalent to an R (insulation) value of 0.5. That’s about the same as an uninsulated wall, and much lower than typical insulated walls. If the sun falls on glazing, even high-performance glazing, it can transmit hundreds of watts of heat per square metre, while creating glare and discomfort for people working near windows. In winter, glazing is a major source of heat loss.
Efforts to improve comfort near windows may involve blowing heated or cooled air over the glazing. This undermines the insulating effectiveness of the still air film, which comprises around two-thirds of the usually quoted insulation value for single glazing.
As you can see, every action has its consequences. If we’re not careful, electrification without improvement in electricity efficiency will amplify both summer and winter electricity peaks, vulnerability to supply failures, and spikes in energy prices.
Adjustable horizontal blade blinds on the exterior of The Fern are equipped with timers and light sensors to further reduce cooling and heating loads.
A look at some data
Buildings Alive provided me with anonymised electricity consumption data from office base buildings that the organisation monitors, including peak electricity demand and annual electricity consumption. This allowed me to analyse the correlation between annual electricity consumption and peak electricity demand in samples of office buildings in Sydney (60 buildings) and Melbourne (18).
The specific data for base buildings, which excludes tenant electricity use, included:
- Peak electricity demand measured in volt-amps per square metre (VA/m2) at time of annual peak demand
- Annual electricity consumption in kWh/m2
- Lettable floor area.
This data has significant limitations, as it does not include gas consumption, but it’s better than nothing. It should also be noted that peak electricity demand is measured in volt-amps (VA), not kilowatt-hours (kWh).
Volt-amps measure “apparent power”, which takes into account energy losses due to the distorting effects of appliances and equipment causing alternating current and voltage to be out of phase, as reflected by power factor. Measurements of annual kWh understate the impact of poor power factors on infrastructure requirements at times of peak demand. While building level demand is measured in kVA (thousands of volt-amps), electricity consumption per square metre is much lower, so it is measured in volt-amps.
Power factor and apparent power explained
Ideally, alternating current and voltage are synchronised or “in phase”. The bigger the difference between kVA and kW, the more energy is wasted and the lower the “power factor”. A power factor of 1 would mean that kVA and kW are perfectly in phase.
The best analogy for this is pushing a swing. If you push the swing at the top of its arc, the pressure input (in this analogy, voltage) is synchronised with the movement of the swing (current, measured in amps), meaning that only a small amount of energy is needed. However, if you try to push the swing when it is not completely through its arc, you’ll be “out of phase”. This means you’ll need a lot more energy to deliver the same amount of movement, with a significant amount of wastage.
In practice, this can have significant impacts, including:
- More energy wasted as heat
- Thicker wires required
- Motors and wiring could overheat
- Reduced efficiency of equipment.
A power factor of 0.7 might not seem too bad, but it has significant implications. This is because kVA = kW/0.7 or 1.4 x kW, meaning that, for a given voltage, current flow will increase by 40 per cent. This results in the near doubling of losses, as losses are proportional to the square of current (1.4 x 1.4 = 1.96).
Demand and consumption
My analysis showed that the peak electricity demand relative to lettable area for Sydney buildings showed significant scatter. Smaller buildings could have peak demand as high as 50VA/m2 or as low as 20VA/m2 (the average is 37VA/m2). The relatively few large buildings in the dataset fell into the range of 20–40 VA/m2.
As noted in the breakout box, VA takes into account the power factor of electricity consumed, which ideally is 1 but is often lower. This matters because electricity retailers often charge extra when the power factor is low. It also means that energy losses in wiring are higher, adding to consumption costs.
It’s important to note that most buildings in Melbourne use gas for heating, while more Sydney buildings may use electricity for heating – we have no data to distinguish between all-electric and gas-electric buildings. My main interest was in the correlation between peak electricity demand and annual consumption.
The results
Figures 1 and 2 show the correlations between peak electricity demand and annual electricity consumption for the samples. Sydney data shows significant scatter both above and below the trendline, with outliers much higher than the trendline. Melbourne data shows even bigger variation around the trendline, and shows more significant variation both above and below the trendline. This could be explained by more Melbourne buildings using gas for heating, and its milder summer climate.
The key message is that annual electricity consumption is not closely related to peak electricity demand.
In Sydney, the outliers have peak electricity demand that is much higher than the trendline. This suggests that, in Sydney, building thermal performance may be more strongly related to electricity demand than in Melbourne. This may be because more buildings rely on electric heating and cooling instead of using gas heating. The Melbourne data shows even more significant scatter, with an R2 value of just 0.34 compared with Sydney’s 0.66.
In Melbourne, peak demand is typically around five times demand averaged over the full year, while in Sydney it is about 4.5 times.
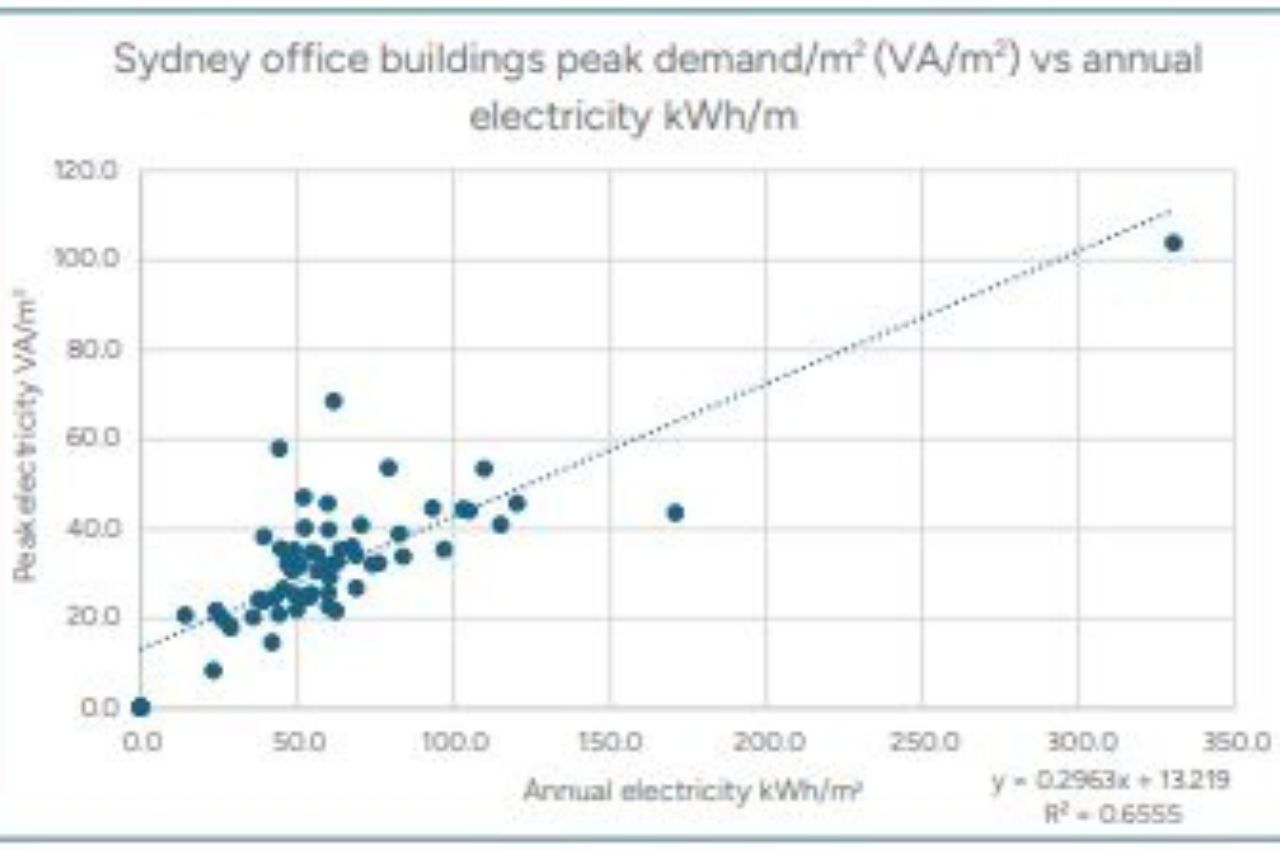
Figure 1. Correlation between peak base building electricity demand and annual electricity consumption, Sydney.
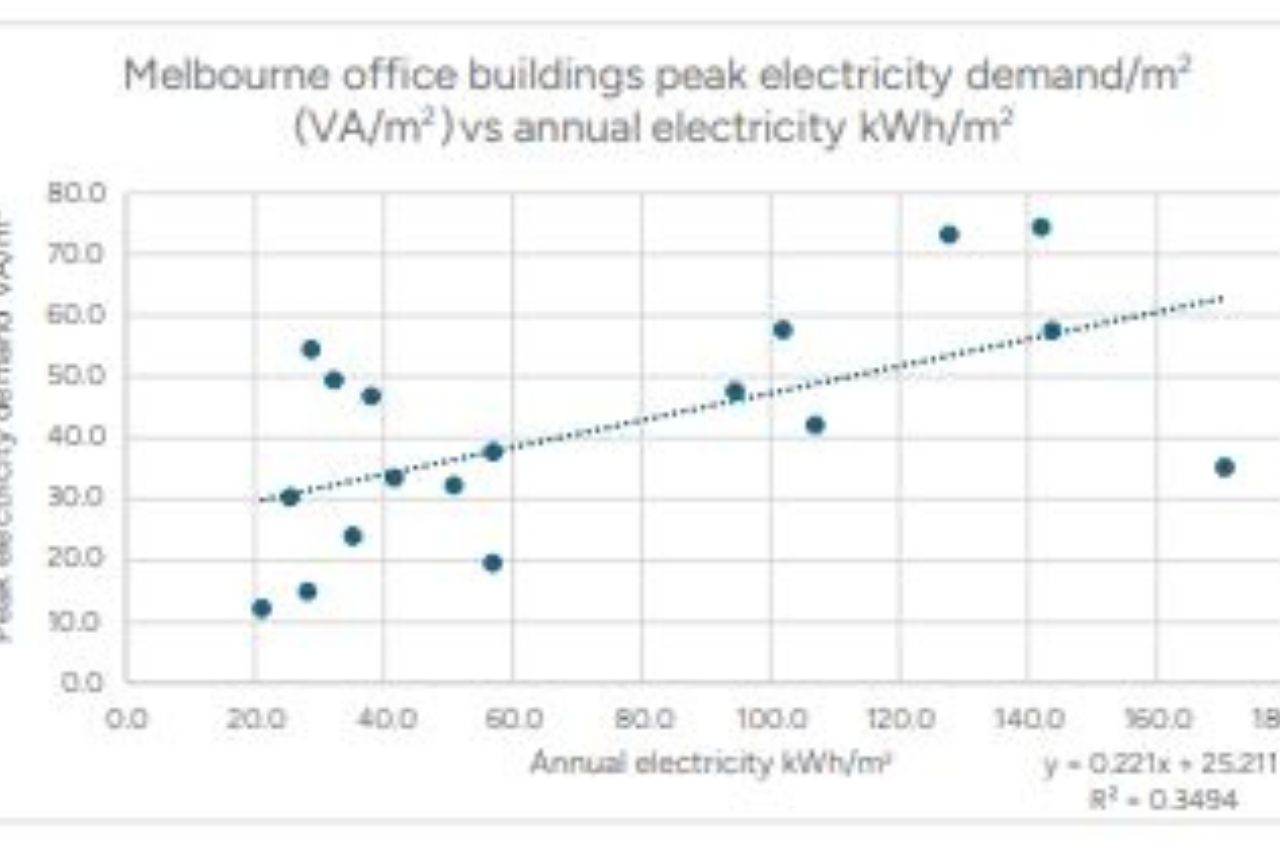
Figure 2. Correlation between peak base building electricity demand and annual electricity consumption, Melbourne.
Tentative explanations
The graphs suggest that annual electricity consumption is not a good indicator of peak electricity demand. This may reflect the reality that NABERS and the National Construction Code do not differentiate between building fabric thermal performance and HVAC efficiency in extreme weather.
The electricity consumption of a building with a high thermal performance envelope is likely to be less impacted by extreme weather conditions because variations in heat flows into the building are smaller than for a poor performing envelope. A building with a thermally poor envelope is more dependent on the efficiency of the HVAC system under extreme weather conditions. Buildings in mild climates may be able to achieve low annual energy consumption (therefore, good NABERS ratings) relative to their peak demand because extreme conditions occur relatively infrequently.
The efficiency and cooling capacity of a chiller declines as the temperature difference across it increases, and fan/pump energy use increases as higher flows of cooled air or water are required in more extreme weather conditions. Energy consumption and output capacity of chillers with cooling towers or evaporative pre-cooling of air are influenced more by wet bulb temperature (ie. humidity), while air-source chiller performance is influenced by dry bulb temperature.
Limitations
The contributions of gas to space heating and peak demand are not considered in this limited sample, because gas data is rarely of high enough frequency to be useful, and gas demand often peaks when buildings are being heated in early morning.
The correlation between gas consumption and heating degree days may be a useful indicator of winter building envelope thermal performance, but this is not explored here. Analysis of Victorian gas daily consumption (not included in this article but included in various submissions I have made) shows that it is around four times higher in cold winter weather than over summer. So, building heating, both commercial and residential, is definitely a major contributor to Victorian gas demand. In Victoria, gas-fired generation also peaks in cold weather.
Detailed evaluation of gas consumption for buildings would be a useful input to planning as we electrify commercial buildings. This may show that a high thermal performance building envelope keeps the building warmer overnight and requires less “start-up” heating, regardless of the energy source, and at a time when heat pump efficiency may be low due to the high temperature rise across the heat pump.
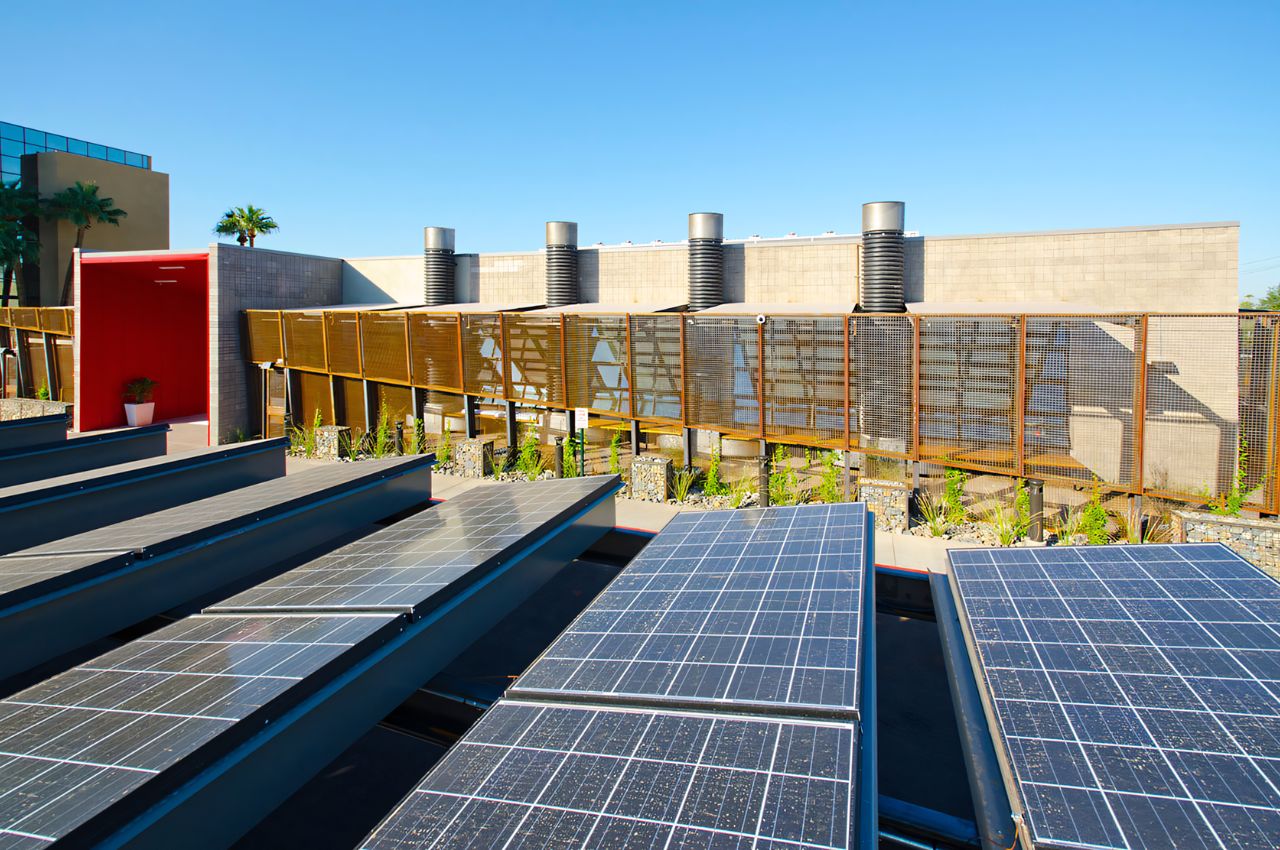
Simply shifting demand to the middle of the day when solar performs best doesn’t necessarily guarantee a reduction in energy usage or bills.
Need for change
Stepping away from this analysis, we come back to the reality that buildings and their HVAC systems are major contributors to electricity and gas peak demand in both summer and winter. It is also clear that, at times of extreme hot or cold weather, heat pump efficiency declines while heating or cooling demand for a building of given thermal performance increases.
These outcomes are complicated by solar gains, through internal heat production, heat flows through the opaque elements of the building fabric, and windows, some of which are exposed to solar radiation while others drive high heat gain or loss. These complications reinforce the case for considering both summer and winter peak energy demand in rating and regulatory schemes alongside existing NABERS ratings based on annual electricity/carbon emissions.
If we are to minimise energy costs and carbon emissions from commercial buildings, we need to use rating systems that factor in peak winter and summer electricity and gas demand. We also need to recognise hourly and seasonal changes both in terms of demand for electricity and the emissions generated in the production of that electricity.
A smarter rating system would likely drive significant and much-needed changes in the way we design commercial buildings. We have the technology and expertise to improve the energy efficiency of our buildings – now it’s time to properly incentivise those improvements.

About the author
Alan Pears AM played key roles in developing what is now NABERS, Australia’s national building energy regulations and appliance energy labelling. He works with the Australian Alliance for Energy Productivity (A2EP), is a policy adviser to the Energy Efficiency Council and a Fellow at RMIT and Melbourne University.


