Planning for carbon neutral in existing buildings
Abstract
This paper explores the role of optimisation of existing infrastructure, onsite renewable and non-renewable generation, hardware changes and energy-procurement activities in achieving carbon neutral status for a mixed-use building in Melbourne, with consideration to moving electricity and gas grid factors (cost and emissions) across 15 years.
The building has already achieved an average NABERS Energy for offices base building rating of 5.5 stars, placing it at the upper end of efficiency for the Australian market.
The challenge for the site, therefore, is to develop a 15-year plan to achieve zero emissions in the most cost-effective manner, allowing for the expected lifespan of plant and the projected changes in the carbon intensity of the electricity grid.
This latter aspect is particularly important, as the site makes extensive use of trigeneration as a means of outperforming the very carbonintensive Victorian electricity grid. The empirical model for site energy use, informed by a site visit, was used as a basis for analysis. The process yielded direct benefits by identifying substantial opportunity to optimise onsite gas trigeneration to reduce building energy usage and expenditure.
Forward performance was modelled via a series of scenarios, which not only considered actions to be undertaken but the optimal timing of those actions relative to business-as-usual plant replacement and the expected electricity grid emissionsintensity trajectory.
By carefully planning plant optimisation, life-cycle upgrades and green energy procurement, the study found that it is possible to halve site energy consumption and the cost of purchasing accredited carbon credit units to offset residual carbon emissions.
Contracting offsite renewables combined with fully retired LGCs using power purchase agreements has the potential to fully pay off its initial investment value, in addition to locking in retail electricity rates that are more attractive than standard retail energy market rates.
Introduction
“Carbon neutral” as defined by Climate Active1 is reducing emissions where possible and compensating for the remainder by investing in carbon offset projects to achieve net zero overall emissions. The aim of the study was to ascertain the incremental steps for a building, named Building A in this paper for anonymity, in order to achieve carbon neutral status within 10 to 12 years.
Building A is a mixed-use commercial office building that is already performing at 5.5 stars base building NABERS energy. The building features a trigeneration plant, which was originally intended to outperform the very carbon intensive Victorian electricity grid. For context, the electricity grid carbon intensity is approximately five times higher than natural gas, based on the Australian National Greenhouse Accounts Factors.4.
Methodology
The Climate Active National Carbon Neutral Standard for Buildings (Building Standard) was chosen as the reference standard due to the ability to use established rating systems such as Green Star Performance or NABERS for certification. The building is already subject to regular NABERS energy ratings under the CBD mandatory disclosure program, and therefore the NABERS pathway would be the least disruptive to building operations. As the building was multi-tenanted at the time, the decision was made to target carbon-neutral base building operations, which does not require tenant or occupant emissions to be considered.
Noting the objective of carbon neutrality to prioritise emissions reduction, Climate Active Carbon Neutral certification is only available for buildings performing at 4 stars NABERS energy or better. As Building A is already performing at 5.5 star, the building meets the eligibility criteria.
The methodology undertaken was as follows:
- Determine the baseline carbon emissions.
- Complete an empirical model of the site energy use, informed by a site visit.
- Model forward performance under a business-asusual scenario and agreed intervention scenarios for the next 15 years (to 2035).
- The final combination of measures and its timing was selected with consideration to a decarbonising electricity grid, energy consumption reduction potential and energy expenditure optimisation.
- Once the combination of measures and timing arefinalised, the residual emissions were categorised into two categories:
- Category 1 relates to emissions that can be removed by procuring zero-emissions energy. At time of writing, only zero-emissions electricity sources are available for purchase.
- Category 2 relates to non-electricity emissions that can be offset by purchasing accredited carbon credit units.
Baseline position
The baseline scope 1, 2 and 3 carbon emissions position (carbon account) of Building A was determined using the definitions provided within Building Standard and NABERS Carbon Neutral market-based calculators. To achieve carbon neutrality, all carbon emissions in the carbon account must be removed or offset using accredited carbon offsets. The different carbon emissions scopes are defined 1 as follows:
Scope 1 emissions are emissions that are owned and controlled by the organisation. For example, natural gas, diesel, leaked refrigerants or fleet emissions.
Scope 2 emissions are emissions from the organisation’s use of electricity. For example, grid electricity imported by the base building.
Scope 3 emissions are emissions that are a consequence of the organisation’s activities, but are not directly owned or controlled by the organisation. For example, waste, staff transport, freight, business travel, water and paper use. Of these, only waste and water are included in the base building’s carbon account due to the immateriality of other emission sources caused by base building activities.
The baseline position of the Building A base building carbon account is shown in Figure 1.
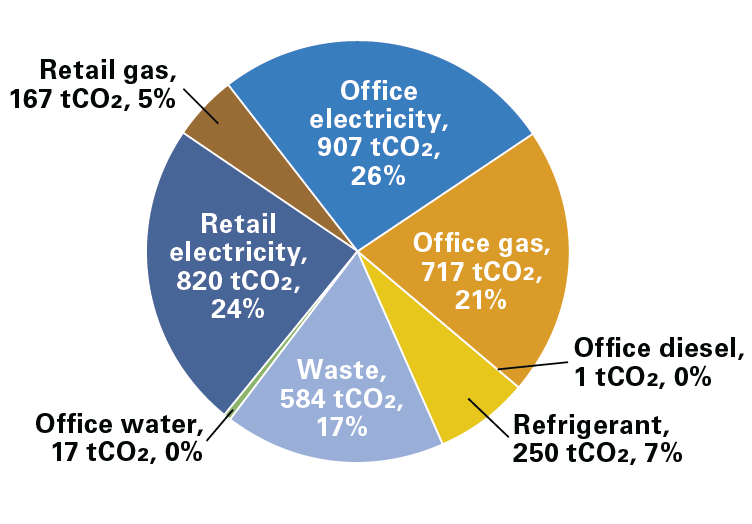
Figure 1 shows that the office electricity and natural gas emissions constitute 47% of Building A’s base building carbon account, followed by the retail electricity consumption and waste-related emissions (combined, a further 41% of the carbon account). While refrigerant leakage, retail natural gas consumption, potable water usage and diesel fuel also contribute to the carbon account, their contribution is relatively small. The focus of this study is the office component of the site, in accordance with the client’s instructions at the time.
In an existing building, carbon-neutral planning should focus on reduction (through decreased/optimised consumption), removal (through replacement of emission sources with zero-emissions equivalents) and finally, through offsets. The baseline carbon account for Building A revealed that priority should be placed on minimisation of the office electricity and gas consumption.
Empirical model of site energy use
The construction of an empirical model of site energy use was particularly important for Building A due to the complexity of interaction between onsite generation, heat recovery to cooling and heating systems, and grid‑imported electricity.
Ultimately, the results of this model informed the potential for emissions reduction through Building A building optimisation, as well as the business case for retaining or replacing the trigeneration plant upon end of life.
An energy mass balance of the site office energy, including the trigeneration plant, was completed, as shown in Figure 2. This was conducted using a combination of sub-metering data, thermal metering, and building management system (BMS) sensor data.
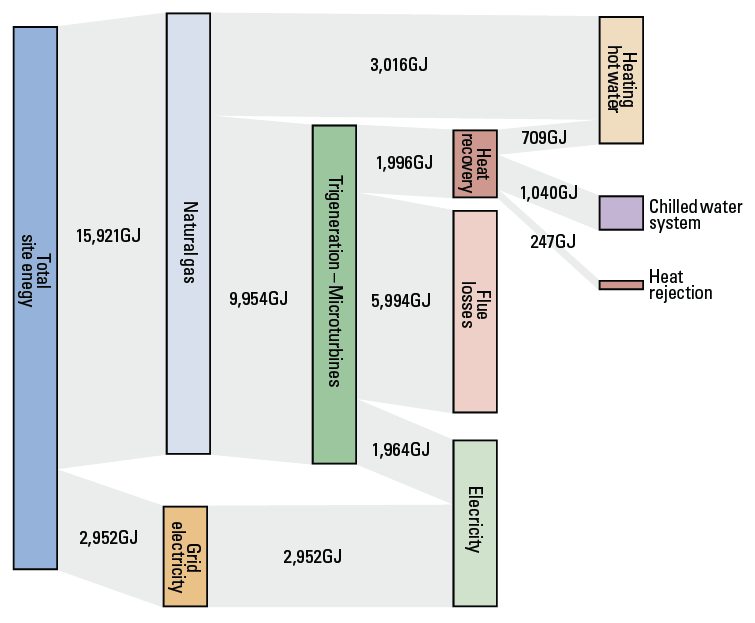
Gaining an understanding of the building trigeneration plant was important, as it impacts the decision as to whether the trigeneration plant should be retained until end of life or decommissioned.
The energy balance revealed substantial optimisation opportunities for the trigeneration plant, which was generating approximately 20% in electricity, but only recovering 20% of heat, with the residual 60% calculated to be lost through the flue. This was contrary to the recuperator microturbine’s theoretical electrical efficiency of 33%, heat recovery of up to 60% and losses of no more than 10%.
As the trigeneration plant comprised 53% of the total site energy use, further investigation into trigeneration plant operation was required. Details on the trigeneration system is presented in Table 1.
| Plant | Description |
|---|---|
| Trigeneration system (Microturbines) | Three 200kWe microturbines with dedicated heat recovery modules. Design leaving hot water temperature (from heat recovery unit) 99 C. Each microturbine operates to ensure at least 10% of total generated electricity is imported grid electricity in adherence to local network distributor restrictions. |
| Absorption chiller | 450kWr LiBr chiller, IPLV 0.792. Design entering hot water temperature is 99 C and design leaving chilled water temperature is 6 C. |
| Hot water heat exchanger | Design temperature is 99 C/89 C across the heat exchanger, but the BMS controls only allows heat exchange between 90 C and 93 C. The design thermal heat transfer is 605kWt. |
| Excess heat rejection | The excess heat rejection heat exchanger activates to maintain the hot water temperature returning to the microturbines at between 83°C and 85°C. |
The trigeneration plant operation was reviewed for two periods of the year – summer and winter.
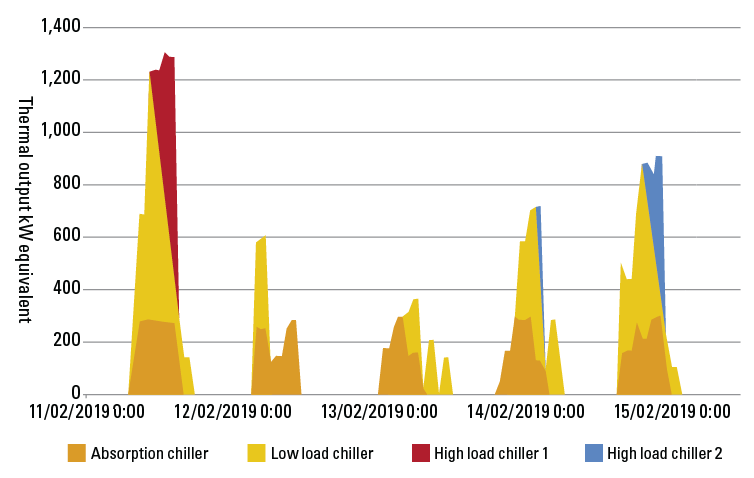
Figure 3 shows the trigeneration plant outputs on a summer week. It confirms the findings from the whole building energy mass balance, that 60% of trigeneration thermal output are flue losses, 15%–20% is generated electricity and 20% is generated chilled water. It also shows that the absorption chiller is operating at 45% of rated thermal capacity, which may not be an issue if there is low cooling demand in the building.
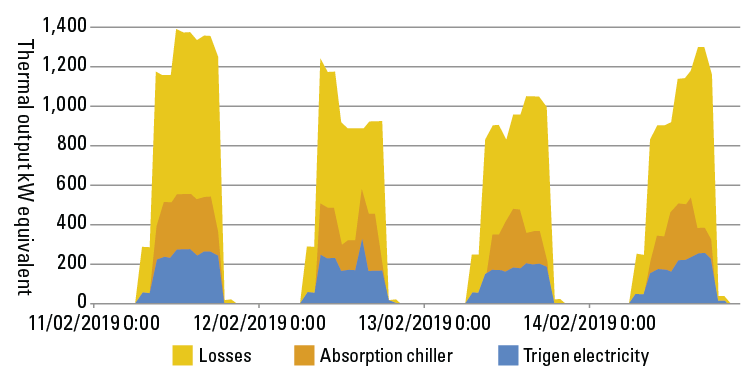
Figure 4 shows the chilled water system load profile in the same summer week, using interval data obtained from the BMS. It shows that there is adequate cooling demand in the building, as other chillers are turning on in response to the building cooling calls. However, in periods when other chillers are operating in parallel with the absorption chiller, the absorption chiller (in grey shade) should, in theory, be operating at full load (450kWr) instead of at part load (~250kWr) as observed in Figure 3. This indicates that there is further opportunity for optimisation.
A similar analysis is undertaken for the winter period, shown in Figure 5. It shows that in winter, the proportion of flue losses are slightly lower at 40%, heat recovery to the heating hot water system is 40%, and the remaining 20% is attributable to generated electricity. Nonetheless, the total heat recovered to the heating hot water system is still lower than its ideal heat transfer (605kWt), and flue losses are still higher than its design heat loss of <10%.
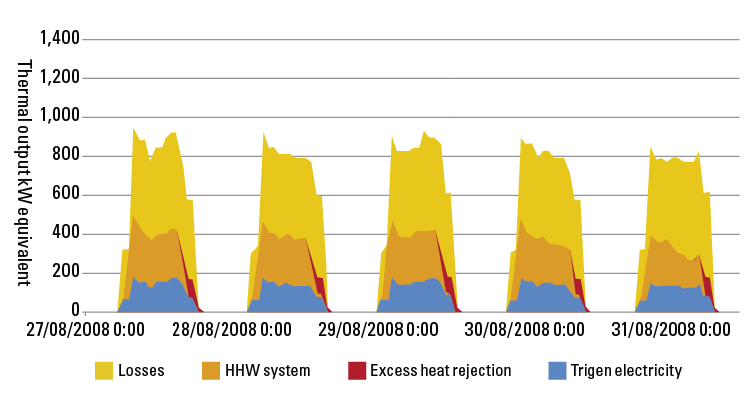
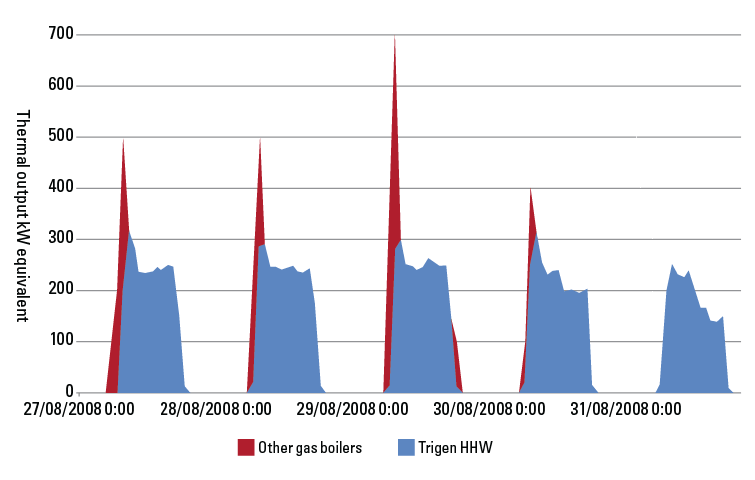
Figure 6 shows that the other gas boilers do not operate when the trigeneration plant is running, suggesting that there is very little space heating demand in this building. Due to lack of data at the time, it was not possible to evaluate how effectively heat was being recovered for the 24/7 domestic hot water load, which is downstream of the heating hot water loop. The early morning spike associated with gas-fired boilers presents an interesting opportunity for consideration – that is for the trigeneration plant to start up earlier, avoiding significant start-up losses associated with natural gas forced draft boilers.
An interrogation of the BMS revealed that the root cause of poor heat recovery to the absorption chiller was sub-optimal microturbine exhaust bypass damper control. Suboptimal exhaust bypass damper control resulted in the leaving hot water temperature from the heat recovery units being less than 85°C, which is much lower than the absorption chiller design hot water temperature of 99°C.
In turn, this led to sub-optimal absorption chiller efficiency, because the absorption chiller efficiency declines as hot water temperature decreases. Additionally, interrogation of the BMS revealed that the heat exchanger to the heating hot water system was frequently isolated, as it did not meet the criteria for suitable heat recovery (because the recovered hot water temperature was less than 90°C).
In summary, the empirical baseline model of the site energy use revealed a sizeable opportunity to reduce building energy consumption by optimising the trigeneration plant operation. Efforts should be directed at improving heat recovery of microturbine exhaust heat to 60–70% and minimising flue losses to approximately 10%.
Scenario modelling
The focus of this study was on the office tower. As such, scenario modelling focused on the office tower plant. Forward projections to 2035 for the Building A office tower were modelled using different scenarios:
- Business-as-usual scenario, whereby equipment was replaced at end of life, with similar equipment, albeit with higher efficiency.
- Existing plant optimisation scenario, whereby HVAC plant and trigeneration performance is improved.
- Bringing forward plant replacement, specifically the trigeneration plant.
- Onsite renewable generation (rooftop solar).
The projections took into account the forecast trajectory of the grid electricity and gas emissions, as well as trajectory of electricity and gas prices (indexed to current prices). These forecasts were referenced from the COAG’s Achieving Low Energy Commercial Buildings report.2
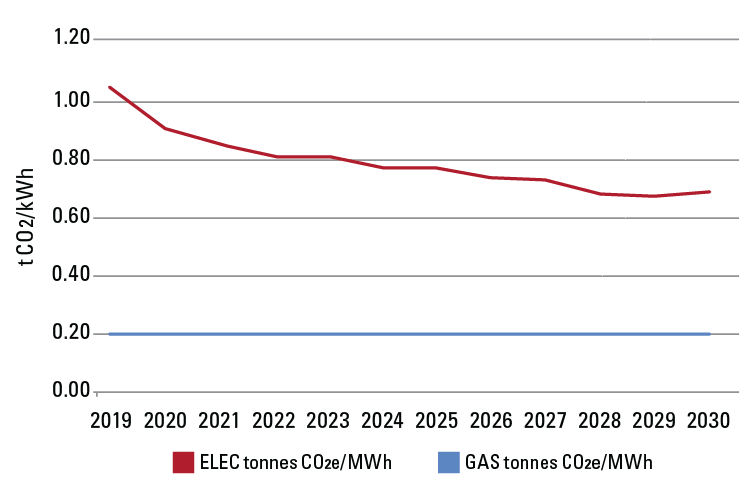
Figure 7 shows the forecast trajectory of the Victorian grid electricity and gas emissions factors between 2019 and 2030. It can be seen that the electricity emissions intensity will decrease by close to 40% by 2030, but despite a decarbonising electricity grid, it will still be three times more carbon intensive than natural gas in 2030.
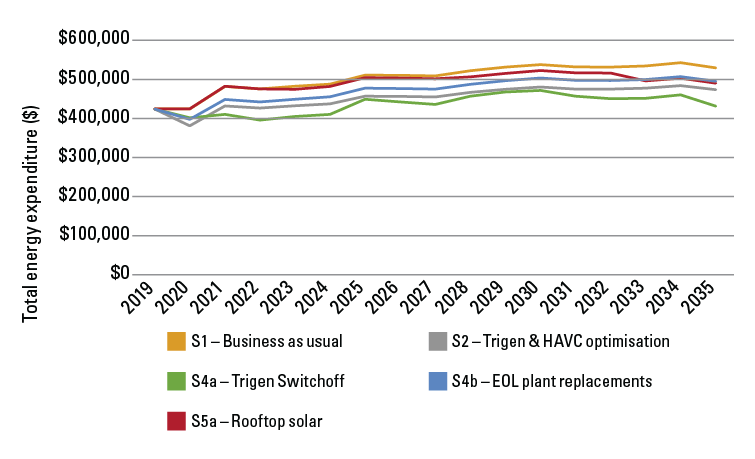
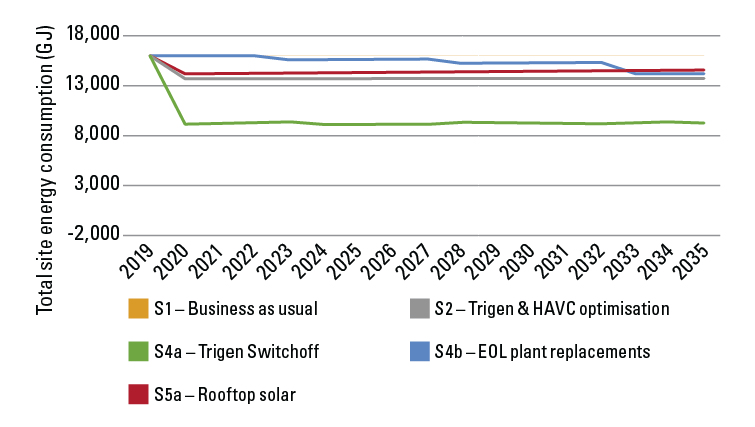
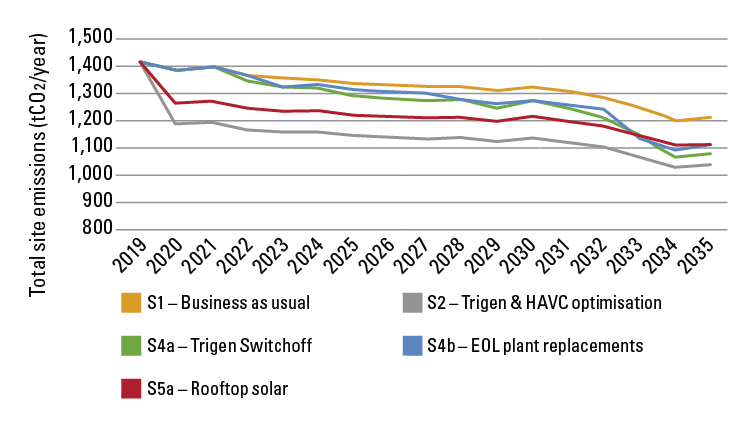
The modelling results are shown in Figure 8 to Figure 10. The standalone modelling found that:
Decommissioning the trigeneration plant (S4a) has the largest impact on site energy consumption, followed by plant optimisation, renewable onsite solar PV (Figure 8).
The results include the increase in grid electricity imported to compensate for the loss of trigeneration electricity.
- Figure 9 shows that from a site emissions perspective, there is no carbon emissions reduction benefit in decommissioning the trigeneration plant early (converse to the results found in Figure 8 with site energy consumption). In fact, unless the NABERS emissions factors are revised, the base building NABERS energy star rating declines, which is unacceptable.
- Decommissioning the trigeneration plant early has the most attractive energy expenditure reduction potential (Figure 10), as it reduces the site’s reliance on natural gas, which is forecast to increase in cost in 2021. Additionally, substantial microturbine maintenance costs (>$50,000) can be avoided once decommissioned.
- Trigeneration and HVAC plant controls optimisation has the greatest site emissions reduction potential. Because there is no physical change in site configuration or infrastructure associated with this intervention measure, this measure, it is considered the most attractive in terms of least disruption to site operations. It is not expected to incur any substantial capital costs.
- Of the end-of-life upgrade measures, the chiller plant end-of-life replacement has the greatest impact at Building A in 2033. The dip in site emissions in 2033 seen in Figure 9 is associated with end-of-life replacement of HFC-refrigerant chillers with low- to zero-global warming potential (GWP) chillers and significant improvement in chiller efficiency. It should be noted that the gas boiler plant end of life is also expected circa 2033. Conversion to an electric heat pump combined with a pipework upgrade to the centralised air handling units will reduce overall site energy consumption due to greater thermal efficiency.
- The 99.9kW rooftop solar PV array specified for the site to further decrease reliance on the carbon intensive Victorian grid electricity ranks second behind optimisation of plant operation. It provides a high site emissions reduction potential, though a high initial capital investment is required.
In order to select the sequence of intervention measures, it was necessary to determine the precedence of various goals and objectives. In the case of Building A, the site emissions reduction potential was elected to be the most important objective. Additionally, any intervention measure chosen must not compromise the 5.5-star NABERS base building energy rating.
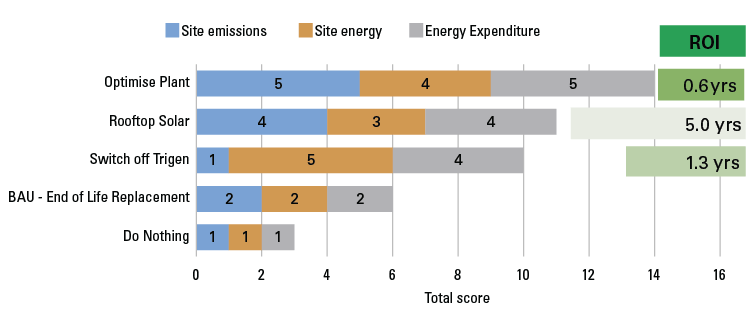
A scoring matrix was developed to determine the order of implementation for each intervention measure. Each standalone measure is scored between 1 (least favourable) and 5 (most favourable) based on its site emissions impact, site energy impact and energy expenditure impact. The return on investment using simple payback is also considered in the ranking. This is shown in Figure 11.
Based on the order of implementation established using the scoring matrix, a combined scenario was modelled based on the timing selections for intervention measures:
- Immediate optimisation activities and rooftop solar installation in 2020.
- Bring forward switching off the trigeneration plant by five years to 2023 (10 years old instead of 15 years). By then the electricity grid is expected to have decarbonised adequately so that the electrical demand transferred from the trigeneration plant to grid electricity will not have a negative impact on site emissions. Additionally, the NABERS greenhouse gas emissions factors for electricity and gas are likely to have been updated to match grid-projections (currently underway through the Future of NABERS Energy project 3).
- Business as usual end‑of‑life technology upgrades for various lighting equipment, chilled water plant, gas-fired boiler plant conversion to heat pump and water-cooled heat rejection plant occurs in 2023, 2028 and 2033.
The modelled office tower annual energy expenditure with the combined scenario is shown in Figure 12 and the modelled site total emissions is shown in Figure 13.
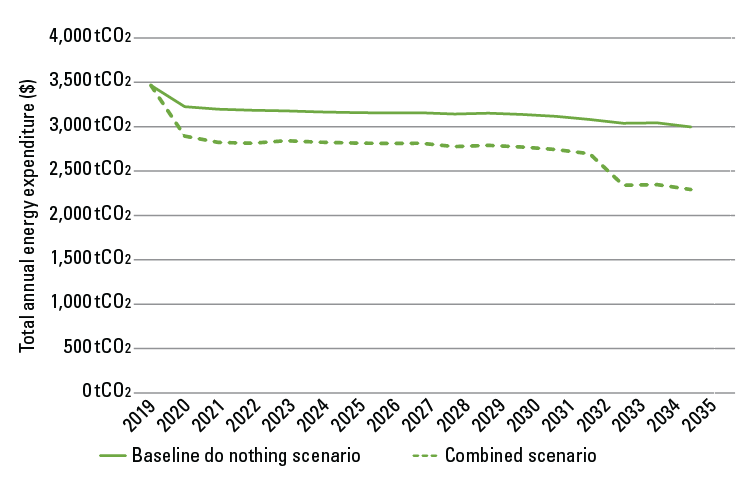
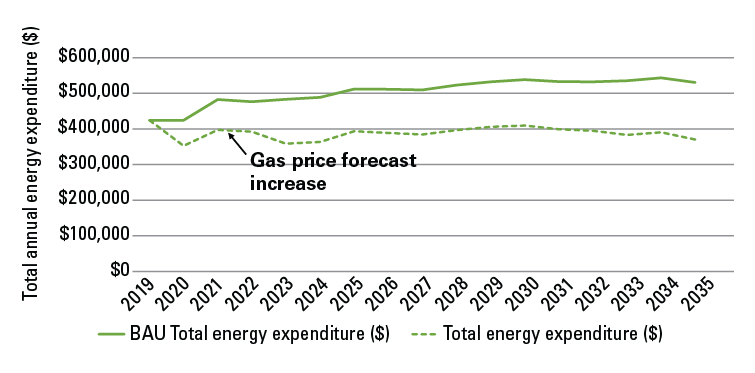
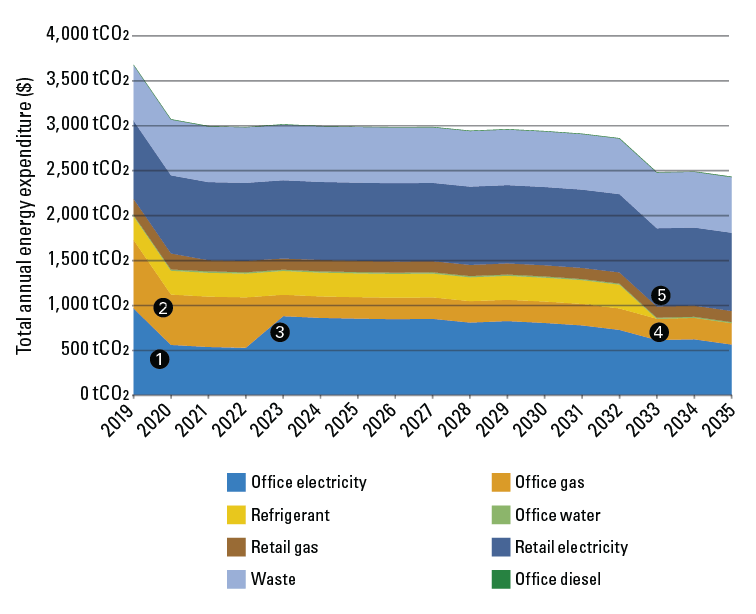
Figure 14 shows a stacked diagram for all site emission sources in Building A under the combined scenario between 2019 and 2035. It shows how each intervention measure impacts the emissions trajectory of end use.
Residual Emissions
The modelled site emissions shown in Figure 13 and Figure 14 represent the residual emissions that require removal or offset.
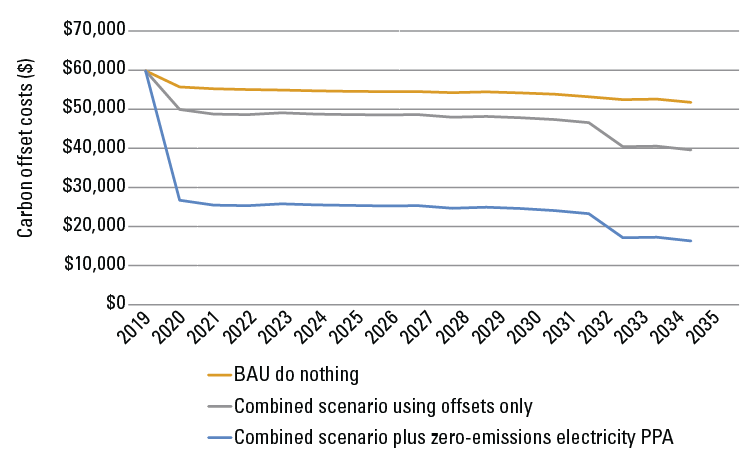
- In Figure 15, the cost to purchase carbon offsets are compared for three scenarios:
- Scenario 1, to use carbon offsets to achieve carbon neutral without additional intervention measures.
- Scenario 2, to use carbon offsets to achieve carbon neutral after the combined set of measures are implemented.
- Scenario 3, to use a combination of carbon offsets and zero-emissions electricity procurement (PPA) to achieve carbon neutral.
The carbon offset costs modelled assumed a $17.20 per tonne carbon* cost for Australian Carbon Credit Units (ACCUs) and $90 per MWh offsite solar PPA cost.
In the zero-emissions electricity PPA scenario (Scenario 3), it is possible for the site to negotiate a competitive electricity tariff such that the net investment for renewable energy is less than $10,000 a year. To claim the electricity as zero-emissions, the site would need to retire the Large Generation Certificates (LGCs) provided by the renewable electricity generator (instead of selling it to the certificates trading market or clearing house).
It can be seen that the carbon offset costs to achieve carbon‑neutral status is halved when combined with a zero‑emissions procurement strategy. Moreover, this does not show the additional energy expenditure avoided from investment in site-based efficiency activities.
Conclusion
This paper presented a methodological approach to planning for carbon neutral for an existing high-performing commercial office building in Melbourne. In existing buildings, developing an empirical energy use model reveals areas of inefficiencies and priority areas. In this particular case study, resolving suboptimal operation of the trigeneration plant heat recovery unit (60% wasted heat) and fine-tuning HVAC plant controls can provide up to $40,000 per year savings in energy expenditure, and reduce site emissions by up to 200 tCO2.
This study also found that the locality of the site impacts the chosen measures to achieve carbon neutral. The building in this case study was located in Victoria, which has a large proportion of generation supplied by carbon-intensive brown coal generators. The onsite gas-fired trigeneration plant plays a large role in reducing the site’s emissions footprint, as natural gas is approximately five times less carbon intensive than Victorian grid electricity. The choice to decommission the trigeneration plant and switch fuels to electricity is heavily dependent on the forward trajectory of grid electricity emissions factors.
The study found that energy consumption can be halved, and combined energy and microturbine maintenance costs of up to $100,000/year could be avoided by switching off the onsite trigeneration plant. However, the carbon emissions impact from switching off the gas-fired trigeneration plant was insignificant in the short term.
As such, for the purposes of carbon neutral certification, it was more effectual in the short term to optimise HVAC controls and tune the existing trigeneration plant, as well as invest in rooftop solar PV arrays. The trigeneration plant can be decommissioned at its end of life when the electricity grid carbon intensity is on its downward trajectory.
Compared to a business-as-usual (BAU) do-nothing scenario, carbon offset costs to achieve carbon-neutral status can be halved by combining zero-emissions electricity procurement and site demand reductions.
Study limitations
This case study did not present optimisation opportunities for other major emission sources such as retail electricity and waste. This was largely due to the commercial focus of the client at time of engagement to prioritise the office component of the asset. Optimisation opportunities within the other emission sources such as retail will be conducted as part of future work.Carbon neutral road maps should be reviewed and revised regularly to account for changes in grid decarbonisation trajectories and technological advancements. For example, there may be options to procure zero-emissions gas in the future, or technology improvements may overcome existing barriers, allowing lower cost building electrification.
Acknowledgements
The contributions to this study of Timothy Leske, M.AIRAH; Dr Paul Bannister, F.AIRAH; and Caoimhin Ardren are gratefully acknowledged.
References
- Australian Government Department of Industry, Science, Energy and Resources. Climate Active Carbon Neutral Standards for Buildings. Can be downloaded at: https:// publications.industry.gov.au/publications/climate-change/ climate-change/government/climate-active/publications.html
- Australia COAG Energy Council (November 2018). Achieving Low Energy Commercial Buildings in Australia. Can be downloaded at: http://www.coagenergycouncil. gov.au/sites/prod.energycouncil/files/publications/ documents/Achieving%20Low%20Energy%20 Commercial%20Buildings%20in%20Australia_0.pdf
- NABERS (May 2020). Future of NABERS Energy. Accessed: https://www.nabers.gov.au/publications/future-nabers-energy NABERS has now updated grid emissions factors. Refer to the NABERS website for NABERS prediction tools.
- Australian Government Department of Industry, Science, Energy and Resources. National Greenhouse Accounts Factors. Can be downloaded at: https://www.industry.gov.au/dataand- publications/national-greenhouse-accounts-factors