Minimising transmission in high occupant density settings, part 1

Abstract
In this first article in a two-part series, we review the current base of knowledge regarding transmission of COVID-19. After briefly introducing a modified form of the Wells-Riley model for predicting the conditional probability of infection within indoor environments, we move on to field experiments conducted in an actual classroom to validate the well-mixed assumption for the Wells-Riley model. Finally, we measure effective filtration efficiency for a range of mask types.
Introduction
The second part of the article (in the June issue of ASHRAE Journal) applies the Wells-Riley model to these experimental results to predict the conditional probability of infection for various protective measures.
Since the report of the first positive case of COVID-19 in November 2019 in Wuhan, China,1 much has been learned about the virus and its effect on humans, yet many questions remain unanswered, including infection control best practices to interrupt or prevent its transmission to mitigate its effects on both people and the global economy. To date, the U.S. Food and Drug Administration has authorized three COVID-19 vaccines for emergency use,2 and by the end of March 2020, more than 54 million people in the U.S. have been fully vaccinated.3 With recent trends in vaccination administration of 2 million doses per day, it will be months before the majority of the U.S. population could be fully vaccinated. Beyond COVID-19, it is highly probable that other, similarly airborne infectious diseases will lead to future pandemics; what we learn from COVID-19 may help us decrease their impact.
Foundational to infection control and prevention is a clear understanding of the mode of transmission of the pathogen. Early in the COVID-19 pandemic emphasis was placed on direct and indirect contact as major modes of transmission, with recommendations focused on hand hygiene and physical distancing. In July 2020, Morawska and Milton, with 239 scientists and medical professionals as signatories, summarized a significant and growing body of evidence supporting airborne transmission of COVID-19 and made an urgent appeal to professionals to pursue the development and implementation of intervention measures to mitigate or interrupt airborne transmission pathways. Subsequent study results aligned closely with Morawska and Milton’s call to action, although for brevity’s sake further published work supporting airborne transmission will not be cited here. One aim of this study is to provide recommendations for interventions that can decrease the likelihood of COVID-19 transmission in high occupant density indoor environments like classrooms.
Aerosol Particles and Airborne Transmission of COVID-19
As Nardell and Nathavitharana note, the term “air–borne” and the related lexicon describing infectious bioaerosols have not been uniformly applied in the literature regarding the person-to-person spread of respiratory pathogens. Here, we define a respiratory droplet as an aqueous droplet composed of saliva, mucous, infectious agent(s), and other biomatter. Respiratory droplets can be generated directly and dispersed to the air by a person coughing, sneezing, talking, singing, or vomiting; and indirectly by the aerosolization of feces during sewage removal and treatment.8 When an infected individual is actively shedding virions being replicated within their body, these dispersed respiratory droplets serve as transport vehicles, with each respiratory droplet potentially carrying a viral payload into the air, where it can infect other individuals in the vicinity (see side–bar “What Viral Payload Could Be Contained Within a Respiratory Droplet?”).
Respiratory droplets can range from submicron to tens or hundreds of microns in diameter. Large droplets (approximately 10 μm or larger) and very large droplets (much greater than 10 μm) tend to either quickly fall to the ground by gravity within about 1.5 m (5 ft) of the generation source or rapidly evaporate. If these large respiratory droplets are inhaled, they tend to deposit into the upper respiratory tract, where viable infectious pathogens within the droplet can infect a susceptible individual.
Aerosol particles are respiratory droplets of smaller diameters, in the 200 nm to 5 μm range. Particles smaller than 10 μm are easily inhaled and able to penetrate farther into the respiratory tract than larger ones, depositing deeper into the lungs.
Our focus in this article is on inhalable virus-laden aerosol particles (bioaerosols) in the 200 nm to 5 μm range. Aerosol particles in this size range have been demonstrated to carry viable SARS-CoV-2,12 and they are consistent with the particle sizes humans generate through activities that are common in a classroom environment, including speaking, coughing and sneezing.8More importantly, aerosol particles in this size range readily breach the current 2 m (6 ft) physical distancing guidelines because of their ability both to remain airborne for extended periods and to be carried by air currents within the indoor environment in what is referred to as “long-range transport.”
Beyond recommendations for hand hygiene, cleaning/sanitizing solid surfaces, and physical distancing, CDC guidelines aiming to limit the spread of COVID-19 in indoor spaces also recommend the following:
- Wearing of face masks. In recommending masks, the CDC excludes medical procedure masks, respirators, or other medical personal protective equipment.
- Ventilation of indoor spaces to the greatest extent possible. This includes increasing total supply air and outdoor air rates when possible and pre-and-post-occupancy ventilation purging of occupied spaces.
In this first part of the series, we show that cloth face coverings provide modest protection from virus-laden aerosol particles based on field measurements of the actual effective filtration efficiency for various types of masks and the importance of proper fit. We also show that increased ventilation rates have a diminishing return on reducing the probability of infection via aerosol particles. Although not explicitly tested during the present work, in-room portable recirculating HEPA air filtration devices can be expected to have a similar effect at reducing the infection probability as increasing room air ventilation rates.
What viral payload could be container within a respiratory droplet?
The answer to this question is not known with certainty, and one can expect the actual number to be highly variable and ranging from a single virion to a maximum number of virions on the limits of volume packing of spheres within a sphere. The diameter of SARS-CoV-2 is approximately 100nm.9If we assume that a 1μm spherical droplet has a packing factor of 0.3, its viral payload could be 300 SARS-CoV-2 virions.
Aerosol Behavior in the Indoor Environment
Estimating the probability of infection by aerosols
In 1974, a measles outbreak occurred in an elemen–tary school in upstate New York. The index case was a second grader who produced 28 secondary cases in 14 different classrooms within the elementary school, and two subsequent generations yielded 60 infections. Riley, et al., analyzed this case and, as part of their analysis, proposed a mathematical model to predict the probability of airborne infection based on indi–vidual characteristics such as breathing rate and on building HVAC characteristics such as room ventilation rate.16Equation 1 shows the equation that Wells-Riley used to model the conditional probability of infection, P, based on a susceptible individual receiving a quan–tum dose, Dq, sufficient to cause infection (see sidebar “Relationship Between Infectious Aerosol Particles and Quantum Dose”).
P = 1 – exp(–Dq)
where the infectious quantum dose, Dq, depends on the average concentration of infectious quanta (i.e., aerosols uniformly distributed throughout the space and carrying a viral or bacterial payload) within the room. In Part 2 of this two-part series, we provide further details on the application of the Wells-Riley model and its use for predicting the conditional probability of infection in order to evaluate a range of potential protective measures.
The predictive capability of the Wells-Riley model depends on establishing accurate values of the various parameters and variables included in the model. Reported here is a summary of field experiments used to determine whether the assumption inherent in the Wells-Riley model, that the indoor space is well-mixed, is appropriate.
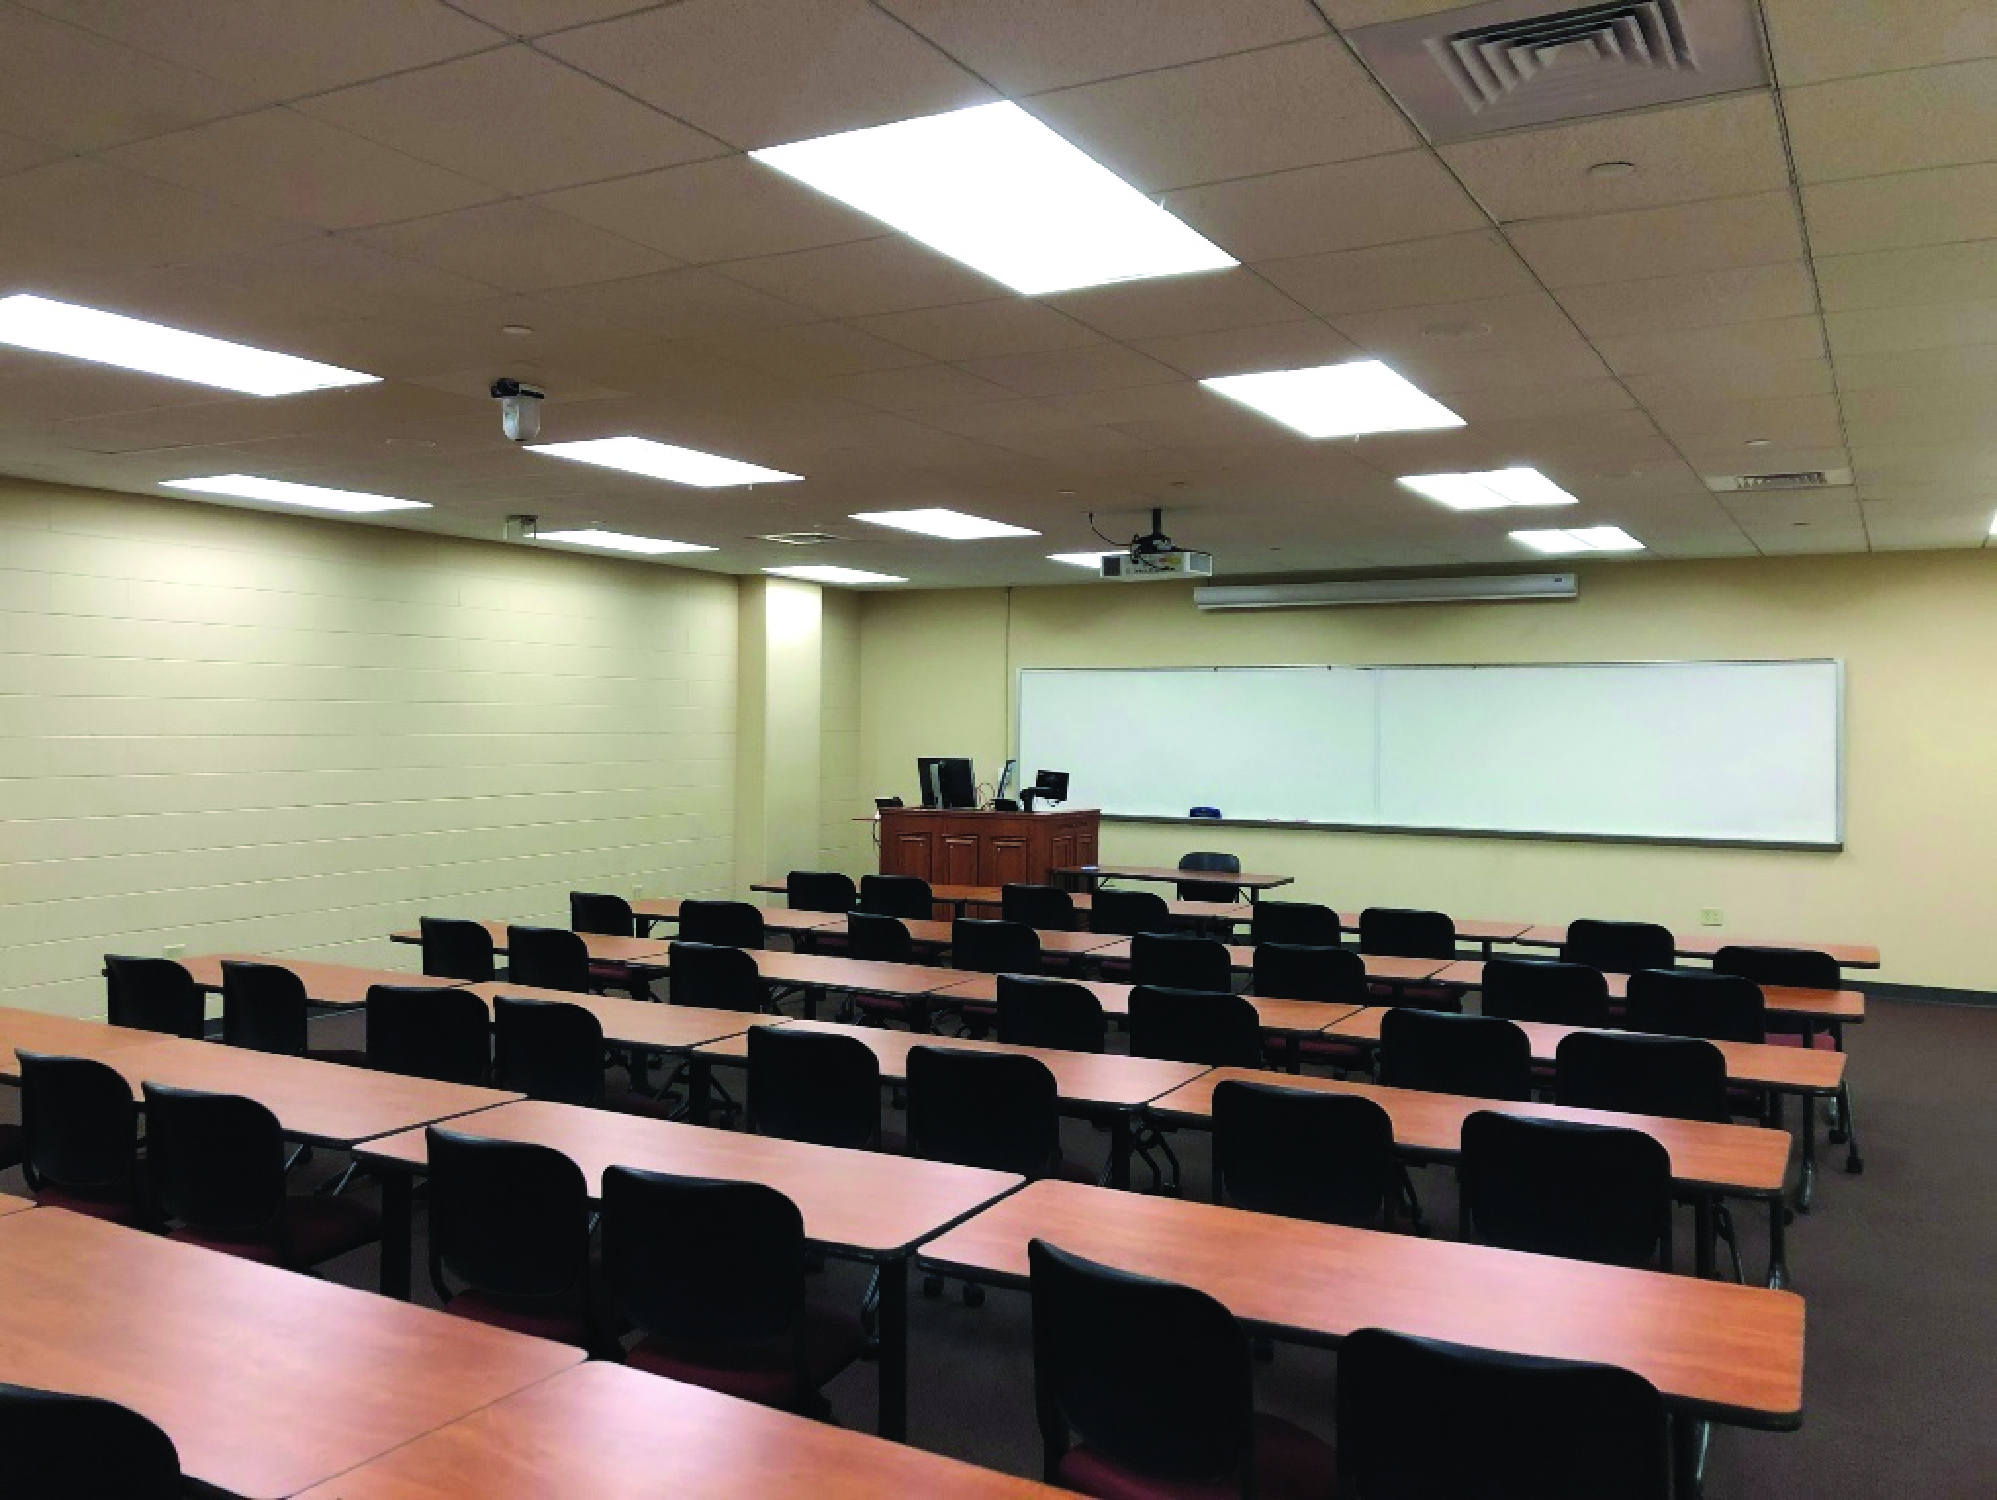
Figure 1. Photo showing the classroom space used as a testbed for the current study (in a pre-COVID-19 layout).
Relationship between infectious aerosol particles and quantum dose
Nardell and Nathavitharana note7 that the seminal work in airborne infection and infection control was conducted by William Wells. Early in the 20th century, Wells conducted experiments at Harvard University and the University of Pennsylvania that produced clear evidence of the airborne route as a mode of transmission of infection.17 Wells used the term quantum to represent the minimum dose of pathogen – in this case, Mycobacterium tuberculosis– necessary to cause infection in the host.
Understanding that airborne infections inherently involve low probabilities due to dilution and other factors, Wells introduced the Poisson distribution in his definition of quantum dose, which represents a threshold number of infective particles breathed that produce infection in 63.2% of occupants. Unfortunately, there is no simple correspondence between bioaerosol droplets that may contain viable virus or bacteria and the quantum dose sufficient to cause infection. As a result, quantum dose values are often back-calculated from outbreak events; those values form a basis for the present analysis.
CLASSROOM SPACE AND EXPERIMENTAL SETUP
Classrooms are generally among the highest occupant density spaces in buildings. Figure 1 shows the actual classroom space, in its pre-COVID-19 layout, used as a test bed for the present study. The classroom measures 126m2 with a ceiling height of 2.87m, yielding a gross room volume of 362m3. The room is served by a central station variable air volume air-handling unit (AHU) equipped with MERV 15 filtration and capable of supplying a maximum total supply airflow rate of 88,892m3/h, with a minimum supply airflow rate of 28,034m3/h. The AHU’s outdoor airflow rate ranges from 20 261 m3/h to 88,892 m3/h. The AHU serves multiple spaces, including classrooms, offices, common areas and lab spaces. The classroom space in the present study has a single VAV box that supplies conditioned room air to four, four-way throw fixed-area diffusers situated overhead and arranged in a rectangular layout. A single overhead return is located near a rear corner of the classroom.
Normally, this room is equipped to accommodate 48 students and one instructor, resulting in an occupant density of 2.6m2/person; however, the room layout was modified in response to COVID-19 for a nominal 2.1m separation between students and a 3m buffer separation between the instructor and seated students. The reconfiguration of the room reduced the occupant capacity from 49 to 17 (16 students and 1 instructor), which decreased the occupant density to 7.4m2/person. Figure 2 shows a plan view of the reduced occupant density classroom along with relative layout of the room’s four HVAC supply diffusers and single overhead return grille. The minimum and maximum supply airflow rates for this classroom space are 39 m3/h and 1,700 m3/h, respectively, corresponding to air change rates that range from 1ach to 4.7ach.To simulate occupants within the room, CPR manikins (torso and head only) were deployed and positioned at each of the 16 student locations, with one positioned at the front of the
room to simulate an instructor (Figure 3). The manikins were modified to enable a generated NaCl aerosol to be discharged through their mouths into the room and/or to draw room air samples through their mouths for particle analysis. This ability to use the manikins for “exhaling” or “inhaling” aerosol enabled assessment of both discharged and drawn-in particle concentrations when the manikins were fitted with face masks. Each student location included an incandescent (75W) light bulb to simulate sensible heat load from occupants.
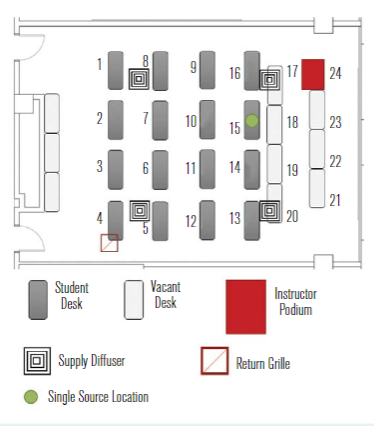
Figure 2 – Plan view of the classroom space used as a testbed for the current study in its reduced occupancy configuration.
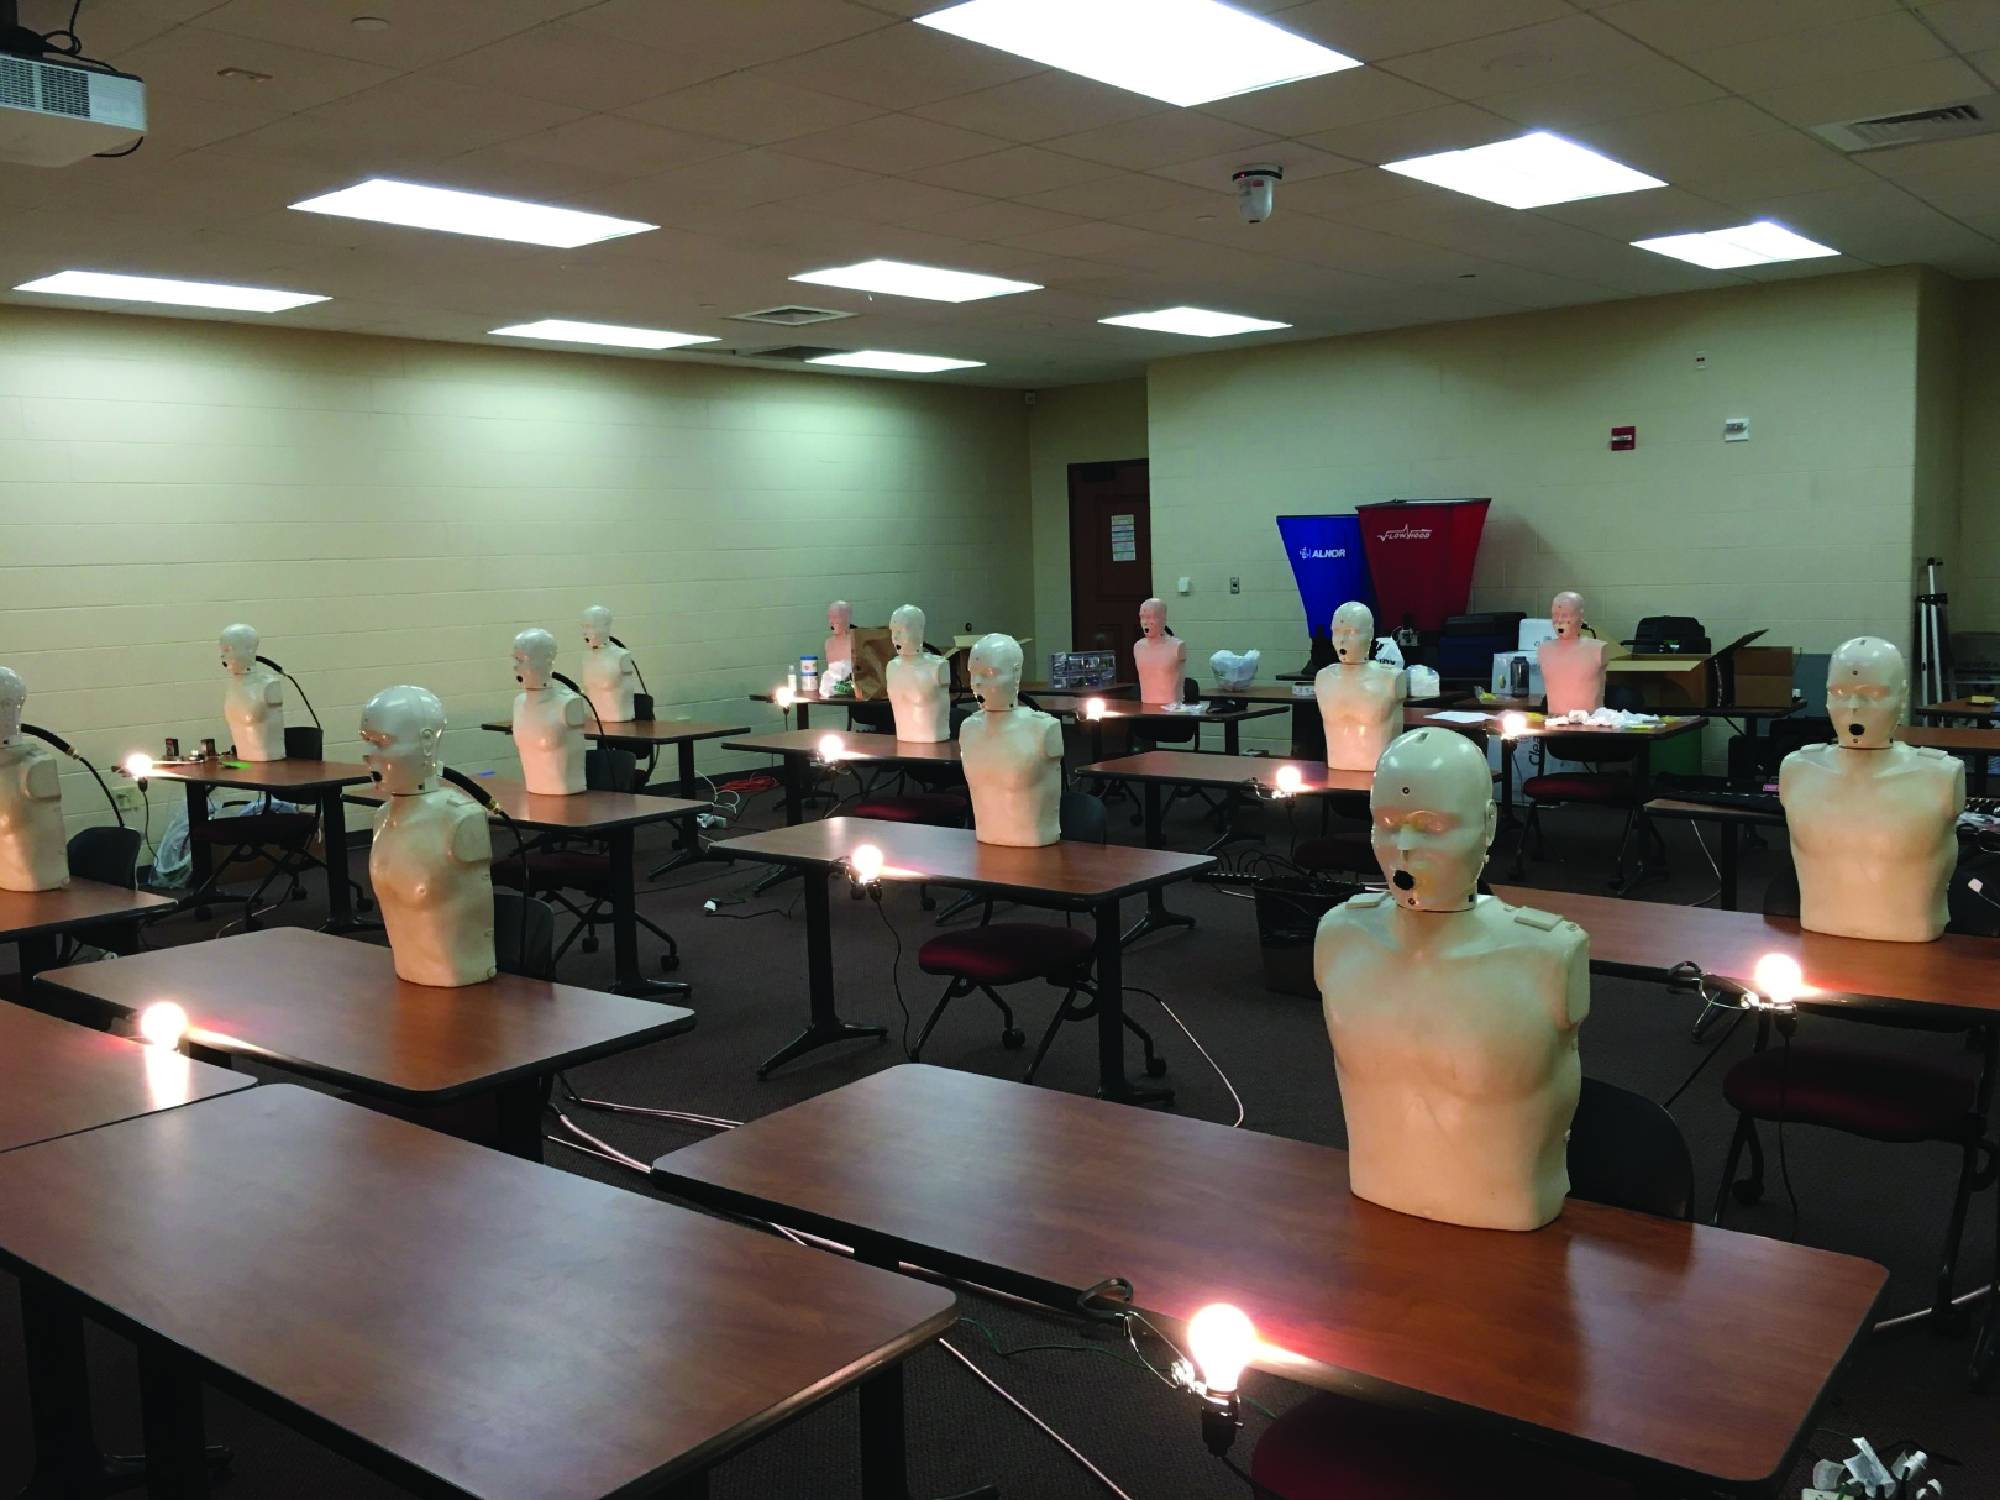
Classroom space set with CPR manikins from the front looking back
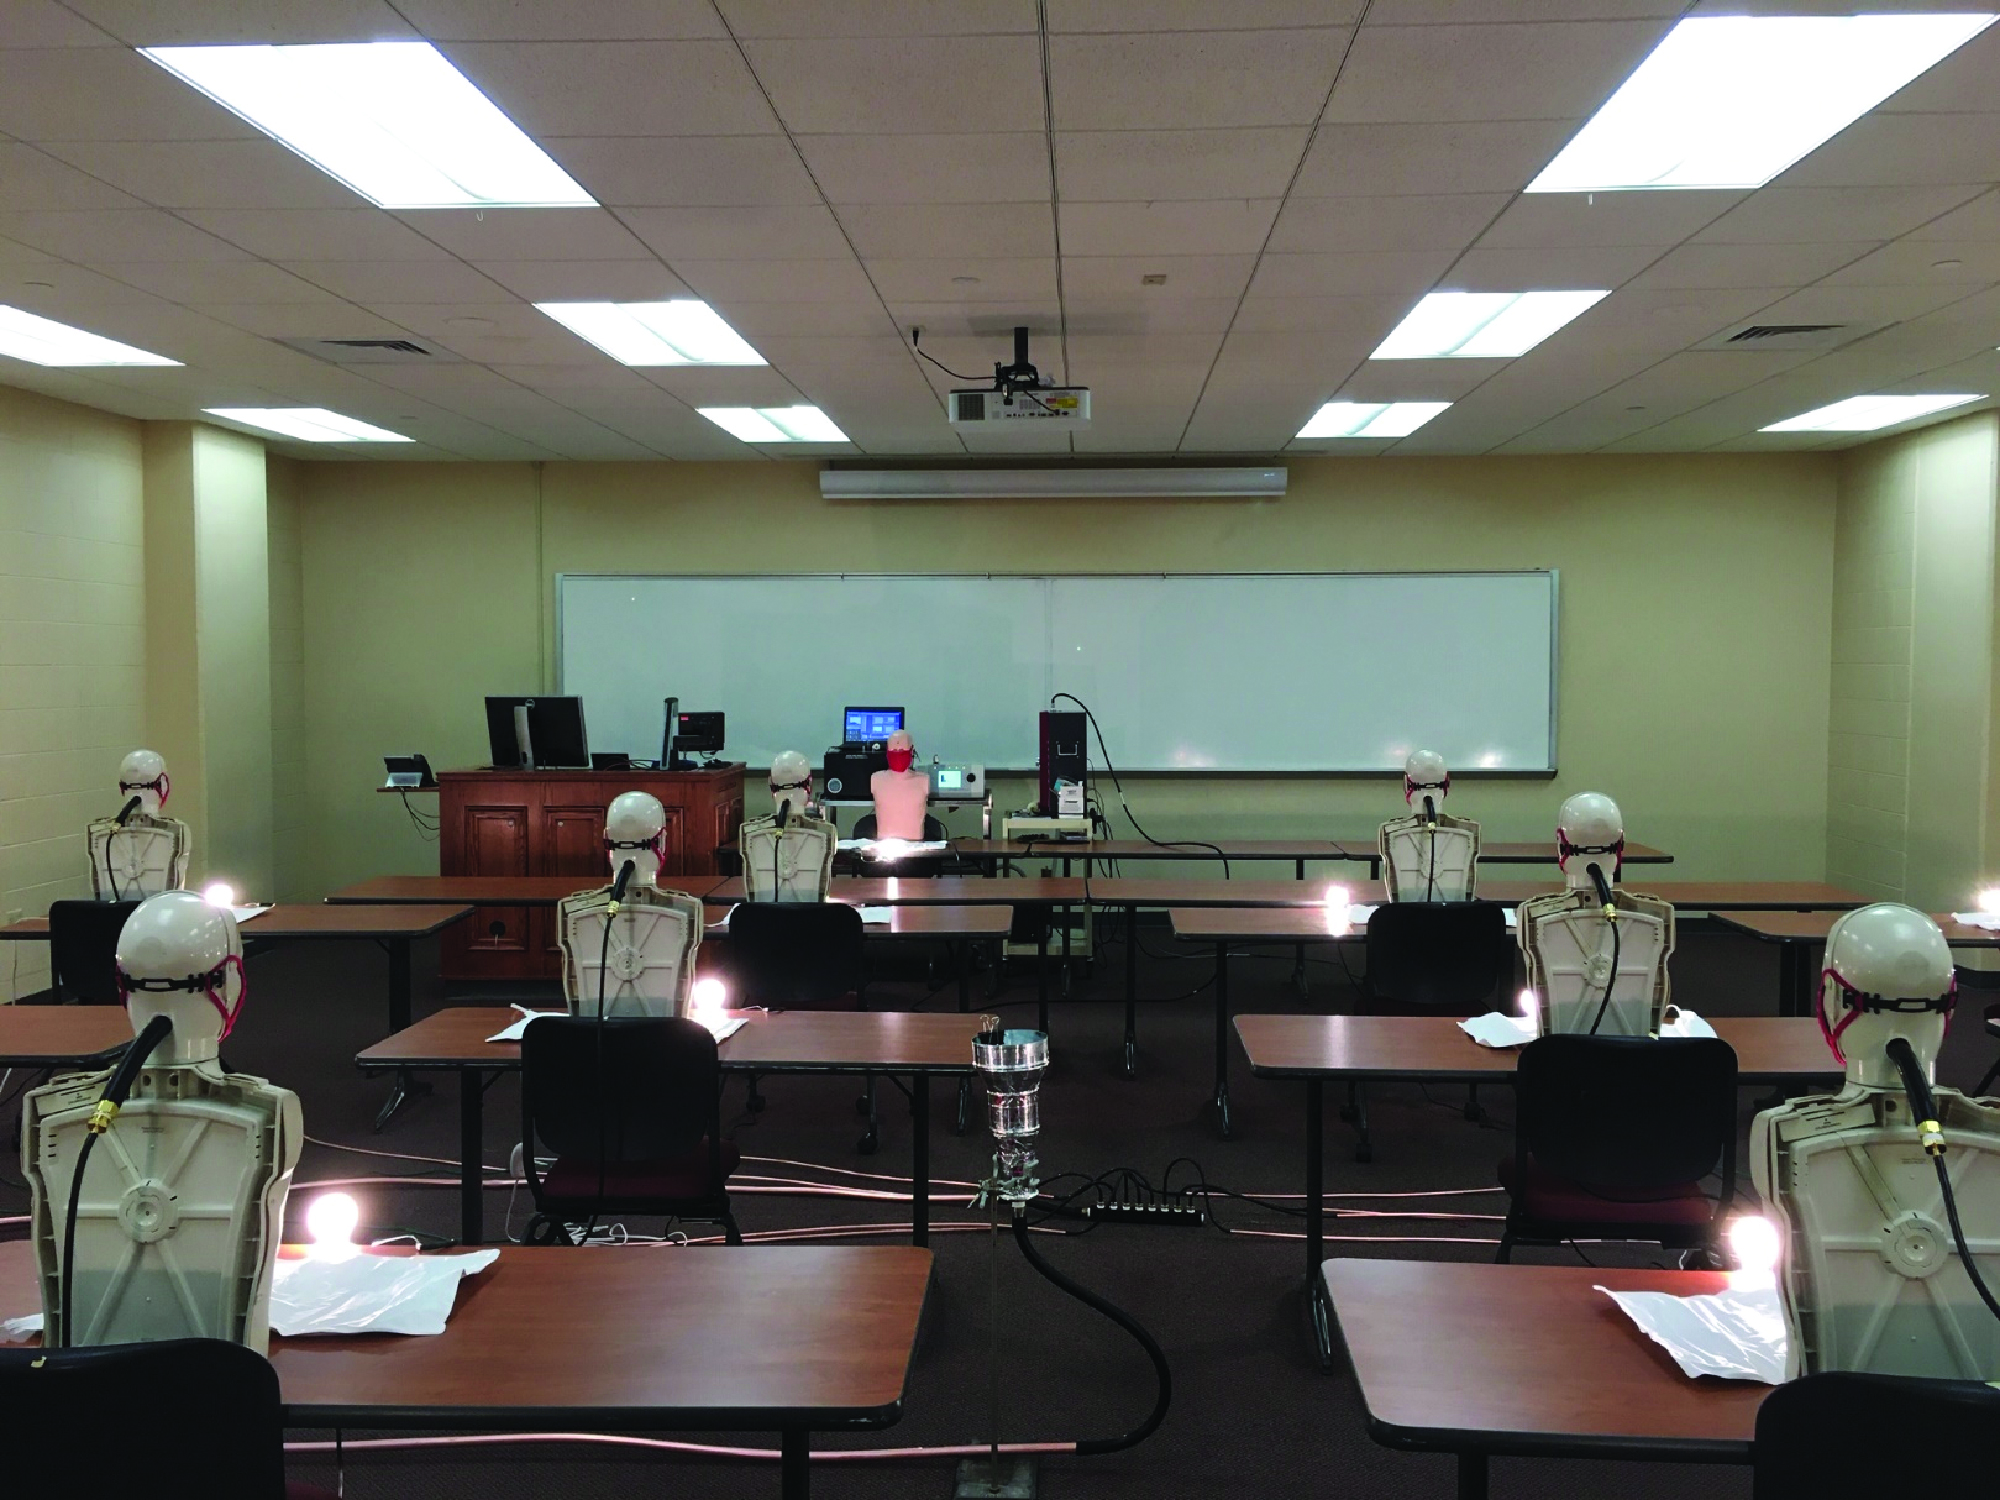
Classroom space set with CPR manikins from the back looking forward
EVALUATING THE WELL-MIXED ASSUMPTION
Aerosol testing was conducted in the classroom to assess validity of the well-mixed assumption in the Wells-Riley model. A polydisperse neutralised salt (NaCl) in an aerosol size range consistent with human-generated bioaerosols containing SARS-CoV-2 was used as a safe surrogate for respiratory droplets or quanta. Although the target aerosol particle size for the study was 200nm to 5μm, the aerosol actually produced and dispersed into the classroom spanned a range of 100nm to 8μm, with the measured distribution shown in Figure 4.
A single manikin at the location indicated by the green dot in Figure 2 was set up to “exhale” aerosol into the room, while the remaining manikins were set up to “inhale” so that the local aerosol concentration could be measured. Figure 5 shows the measured distribution of aerosol concentration for two different aerodynamic diameters, 0.728μm (a) and 2.71μm (b). The aerosol concentration is normalised by the lowest concentration in the room for each diameter and case shown. The normalised concentration distribution for the 0.728μm aerosol size was generally more uniform than that for the 2.71μm size. Not surprisingly, the normalised aerosol concentration near the source trended higher in both cases.
Additional tests were conducted with manikins being equipped with masks, and similar aerosol distribution trends were noted. The greater nonuniformity in aerosol concentration for the larger size suggests that a higher fraction of the larger particles settled rather than being transported throughout the room on air currents, as was the case for the smaller 0.728μm size aerosols. This result implies that smaller particle sizes may be more uniformly distributed in the room and that the well-mixed assumption may hold better for particle sizes in this general size range. Further details on the aerosol dynamics for this space are provided by Rothamer, et al.
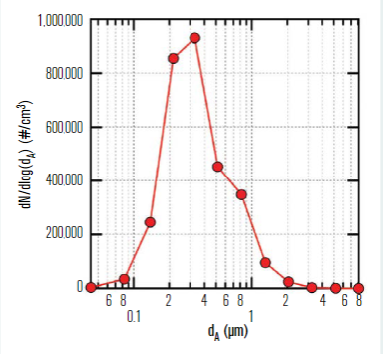
Figure 4 – NaCl aerosol size distribution measured in the room at steady-state conditions.
MASK EFFECTIVE FILTRATION EFFICIENCY MEASUREMENTS
Currently, many locales have established requirements for “face coverings” in buildings and, in some cases, in public spaces outdoors. These requirements have resulted in individuals wearing a wide range of coverings for compliance, including bandanas and cloths pulled up onto the face, among others. Here we evaluate various types of masks designed to cover the nose and mouth with the intent of providing protection for the wearer (inhalation) and for those in physical proximity to the wearer (exhalation). We did not evaluate the various ad hoc face coverings such as bandanas and other similar coverings, as they afford minimal protection.
Figure 6 shows three of the mask types tested and their relative fit to the faces of the manikins. They include a commercial four-ply knit cotton mask (Figure 6a and 6b); a three-ply spunbond polypropylene mask designed by the University of Wisconsin–Madison Emergency Operations Committee (EOC) and produced by a local custom sewing manufacturer, referred to as the EOC mask throughout; a single-use three-ply disposable mask with a meltblown polypropylene center ply, referred to as the procedure mask; (Figure 6c and 6d); and an ASTM F2100 Level 2 rated surgical mask (Figure 6e and 6f ).
Apart from the filtration ability of the mask’s media, the lack of proper mask fit to facial contours enables considerable air bypass, thereby compromising the effective filtration efficiency of the mask as worn. Here we define effective filtration efficiency as a measure of aerosol removal performance that accounts for both the mask media and the mask fit. This metric is vitally important, as we will show what should be obvious – namely that poor fit = poor performance, regardless of the filtration rating of the mask media.
As part of the experimental work conducted to measure mask effective filtration efficiency, we evaluated the use of a mask fitter developed in collaboration with Lennon Rodgers at the UW–Madison Makerspace (UW-Madison Fitter) and a commercial mask fitter (Commercial Brace) mask brace. These devices are designed to improve the mask’s seal to the user’s face to minimise inhaled or exhaled air leakage around the mask. Mask fitters or braces better enable the mask to achieve full filtration potential consistently.
Figure 7 shows the measured effective filtration efficiencies for the masks considered in this study, both alone and in combination with the above-mentioned mask braces. The most dramatic result is the single-use procedure mask, which had an effective filtration efficiency of ηf,Minh = 0.158 ±0.042 when used alone, but a significantly improved effective filtration efficiency of ηf,Minh = 0.949 ±0.026 with the use of the commercial mask brace. In all cases, the use of a mask-fitting device significantly improved the mask’s effective filtration efficiency by reducing air leakage around the mask.
It is also noteworthy that while the four-ply cloth mask with a very low effective filtration efficiency of ηf,Minh = 0.075 ±0.043 does benefit from the addition of a mask brace, its effective filtration efficiency is still quite low with the mask brace. Further details on the mask effective filtration efficiency measurements, including size-resolved data, can be found in Rothamer, et al.18Part 2 of this two-part series will utilise the field-measured data and provide evaluations of various measures aimed at reducing the probability of infection in high-occupant-density indoor environments.
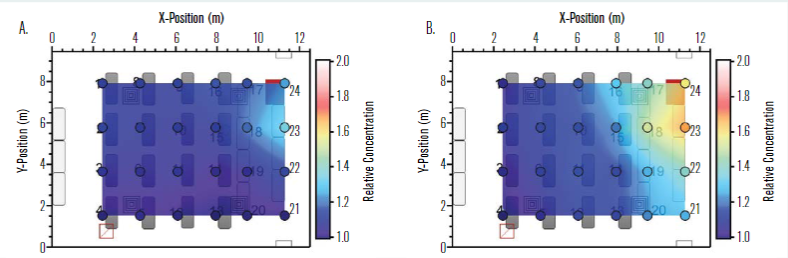
Figure 5 – Normalised concentration distribution in the classroom with a single emitting source at location 15 (see green dot in Figure 2) for aerodynamic diameters of (a) 0.728μm and (b) 2.71μm where the lowest concentration in the room is used for normalizing the concentration results for each respective diameter and case shown.
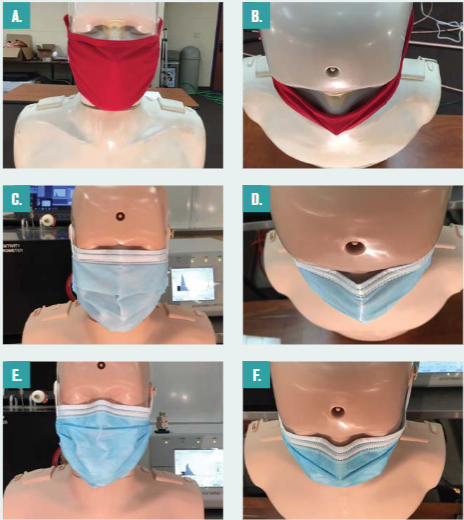
Figure 6 – Masks considered including (a) four-ply cloth face mask and (b) overhead view of four-ply cloth face mask showing lack of fit around the nose; (c) procedure mask and (d) overhead view of the procedure mask showing better fit around nose; (e) ASTM Level 2 mask and (f ) overhead view of ASTM Level 2 showing even better fit around nose compared to the procedure mask.
Figure 7 shows the measured effective filtration efficiencies for the masks considered in this study, both alone and in combination with the above-mentioned mask braces. The most dramatic result is the single-use procedure mask, which had an effective filtration efficiency of ηf,Minh = 0.158 ±0.042 when used alone, but a significantly improved effective filtration efficiency of ηf,Minh = 0.949 ±0.026 with the use of the commercial mask brace. In all cases, the use of a mask-fitting device significantly improved the mask’s effective filtration efficiency by reducing air leakage around the mask.
It is also noteworthy that while the four-ply cloth mask with a very low effective filtration efficiency of ηf,Minh = 0.075 ±0.043 does benefit from the addition of a mask brace, its effective filtration efficiency is still quite low with the mask brace. Further details on the mask effective filtration efficiency measurements, including size-resolved data, can be found in Rothamer, et al.18Part 2 of this two-part series will utilise the field-measured data and provide evaluations of various measures aimed at reducing the probability of infection in high-occupant-density indoor environments.
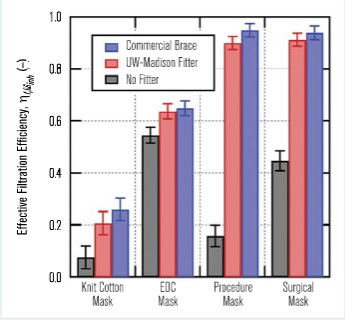
Figure 7 – Overall effective filtration efficiency for inhalation, ηf,Minh, measured for the four masks tested in this work both with and without a mask braces (commercial brace and UW-Madison fitter).
CONCLUSIONS
Field experiments were conducted using a polydisperse neutralized salt (NaCl) generated in an aerosol size range consistent with SARS-CoV-2. The concentration distribution of aerosols was measured for two different aerodynamic diameters: 0.728μm and 2.71μm. The spatial distribution for the 0.728μm aerosol size was generally more uniform than that for the 2.71μm size, suggesting that a higher fraction of the larger particles settled more rapidly compared to the smaller size aerosols.
This result implies that smaller particle sizes may be distributed more uniformly in the room and that the well-mixed assumption in the Wells-Riley model may hold better for these particle sizes. Although the concentration near the aerosol source trended higher as expected, the measurements of the time-resolved and size-resolved NaCl aerosol concentrations support the well-mixed assumption for the Wells-Riley model.
Field measurements of effective filtration efficiency were conducted for four different mask types: a commercial four-ply knit cotton mask, a three-ply spunbond polypropylene mask (EOC mask), a single-use three-ply disposable procedure mask and an ASTM F2100 Level 2 rated surgical mask. The four-ply knit cotton mask had the lowest effective filtration efficiency at 0.075 ±0.043, while the EOC mask had the highest effective filtration efficiency at 0.545 ±0.031. The Level 2 rated surgical mask had an effective filtration efficiency of 0.447 ±0.038.
In all cases, the effective filtration efficiency for the masks improved when an external mask brace or mask fitter was used to enhance mask sealing. The margin of improvement in effective filtration efficiency with a mask fitter was dramatic. The single-use procedure mask saw the most significant improvement in filtration efficiency with the use of a mask fitter, increasing from 0.158 ±0.042 alone to 0.949 ±0.026 with the addition of a mask fitter.
References
- Lawrence, S.V. 2020. “COVID-19 and China: a chronology of events (December 2019 – January 2020).” Congressional Research Service. https://tinyurl.com/9t8n6z2, updated May 13, 2020.
- FDA. 2021. “COVID-19 Vaccines, COVID-19 Vaccines Authorized for Emergency Use.” U.S. Food & Drug Administration. https://www.fda.gov/emergency-preparedness-and-response/coronavirus-disease-2019-covid-19/covid-19-vaccines
- CDC. 2021. “COVID-19 Vaccinations in the United States.” U.S. Centers for Disease Control and Prevention.” https://covid.cdc.gov/covid-data-tracker/#vaccinations
- WHO. 2020. “Recommendations to Member States to improve hand hygiene practices to help prevent the transmission of the COVID-19 virus: interim guidance, April 1, 2020.” World Health Organization. https://apps.who.int/iris/handle/10665/331661
- WHO. 2020. “Key Planning Recommendations for Mass Gatherings in the Context of Covid-19: Interim Guidance, May 29, 2020.” World Health Organization. https://tinyurl.com/ncptdcab
- Morawska, L., D.K. Milton. 2020. “It is Time to Address Airborne Transmission of Coronavirus Disease 2019 (COV ID -19).” Clinical Infectious Diseases 71(9):2311 – 13. https://doi.org/10.1093/cid/ciaa939
- Nardell, E.A., R.R. Nathavitharana. 2020. “Airborne spread of SARS-CoV-2 and a potential role for air disinfection.” JAMA 324(2,June):141 – 42. https://doi.org/10.1001/jama.2020.7603
- Morawska, L., G.R. Johnson, Z.D. Ristovski, M. Hargreaves, et al. 2009. “Size distribution and sites of origin of droplets expelled during expiratory activities.” Journal of Aerosol Science 40(3):256 – 69.
- Bar-On, Y.M, A. Flamholz, R. Phillips, R. Milo. 2020. “SARS-CoV-2 (COVID-19) by the numbers.” eLife 9(March):e57309. https://doi.org/10.7554/eLife.57309
- Xie, X., Y. Li1, A.T.Y. Chwang, P.L. Ho, et al. 2007. “How far droplets can move in indoor environments – revisiting the Wells evaporation-falling curve.” Indoor Air (17):211 – 55.
- Heyder, J., J. Gebhart, G. Rudolf, C.F. Schiller, et al. 1986. “Deposition of particles in the human respiratory tract in the size range 0.005 – 15 μm.” Journal of Aerosol Science 17( 5 ) : 811–2 5 .
- Chia, P.Y., K.K. Coleman, Y.K. Tan, S.W.X. Ong, et al. 2020. “Detection of air and surface contamination by SARS-CoV-2 in hospital rooms of infected patients.” Nature Communications 11: 2 8 0 0 . https://doi.org/10.1038/s41467-020-16670-2
- CDC. 2021. “Operational Strategy for K-12 Schools Through Phased Prevention.” Centers for Disease Control and Prevention. https://tinyurl.com/848emd2w
- CDC. 2020. “Considerations for Institutions of Higher Education.” Updated December 14, 2020. Centers for Disease Control and Prevention. https://tinyurl.com/f8874ubp
- CDC. 2020. “Guidance for Wearing Masks: Help Slow the Spread of COVID-19.” Centers for Disease Control and Prevention. Updated December 7, 2020. https://tinyurl.com/dufvvszk
- Riley, E., G. Murphy, R. Riley. 1978. “Airborne spread of measles in a suburban elementary school.” American Journal of Epidemiology 107(5):421–32.
- Wells, W. 1955. Airborne Contagion and Air Hygiene. Cambridge, Mass.: Harvard University Press.
- Rothamer, D., S. Sanders, D.T. Reindl, T. Bertram. 2021. “Strategies to minimize SARS-CoV-2 transmission in classroom settings: combined impacts of ventilation and mask effective filtration efficiency.” Submitted to Indoor Air, preprint available at https://www.medrxiv.org/content/10.1101/2020.12.31.20249101v1

This article appears in Ecolibrium’s June-July 2022 edition
View the archive of previous editions


Latest edition
See everything from the latest edition of Ecolibrium, AIRAH’s official journal.