Techno-economic evaluation of integrating a PCM thermal battery into cooling systems
Abstract
This paper presents a techno-economic evaluation of a phase change material (PCM) thermal battery (TB) system developed through an industry-university cooperation project. The innovative PCM-TB incorporates a newly formulated salt-hydrate PCM with 15˚C phase change temperature (PCT) and an optimised heat exchanger design. Experimental testing under various real-world conditions was conducted to assess the system performance.
Electricity consumption data with and without the TB were generated using simulation software and compared to evaluate its effectiveness. The study also examined the system impact on demand shifting and electricity cost savings using Australia’s time-of-use electricity pricing system.
Introduction
With the growing demand for energy and the increasing concerns over greenhouse gas emissions, there has been a significant focus on the development of renewable energy sources and energy efficiency measures. One promising area of research is the use of TB systems using phase change materials (PCM) to shift energy demand from peak to off-peak periods, reducing the strain on the building cooling system and decreasing energy costs. Numerous studies have investigated the use of PCMs in various applications, such as building walls and roofs, as a thermal storage for heating and cooling by integrating them into HVAC and photovoltaic systems, reverse cycle heat pumps, and solar collectors [1]. These studies have demonstrated that the incorporation of PCM can significantly reduce total energy consumption, provide better means for renewable energy utilisation, and mitigate peak demand [2].
In addition, economic evaluation of PCM application has been conducted using various methods such as life cycle cost (LCC) [3], net present value (NPV), internal rate of return (IRR) and payback period analyses [4]. The research further reconfirms the advantages of utilising PCM technology. For example, in 2010, a study was conducted in a Mediterranean climate on a building with a volume of 3m3. A PCM was used as a building wall material, and the economic evaluation method of life cycle assessment (LCA) was employed. The study found that the application of commercial paraffin-based PCM and salt-hydrate PCMs resulted in 10.4% and 12% lifetime cost savings, respectively. Additionally, the study highlighted that the use of salt hydrates is preferable to paraffin for reducing the manufacturing and disposal impacts [5].
Although numerous studies have explored the potential of TBs for building cooling applications, most of these studies are limited to theoretical and laboratory-scale investigations, and practical commercial applications are still infrequent. Additionally, it is challenging to find suitable PCMs with PCTs ranging from 0~20°C to meet the necessary thermal storage requirements for building cooling applications. Therefore, currently, the thermal storage market for refrigeration/cooling is focused on using ice or subzero PCMs [6, 7]. This is due to the limited availability of viable PCM options with a melting temperature range of 0~20°C. Although organic PCMs with suitable melting points are available, their application in building cooling has been limited due to their low thermal conductivity and latent heat capacity and their potential fire risk.
Various studies have been conducted on the application of ice thermal energy storage in buildings, all of which demonstrate its effectiveness in reducing peak loads and its economic feasibility [6].
For example, a techno-economic analysis conducted on a full-scale cold storage installation in a multi-story office building in Gothenburg, Sweden [8], identified that the estimated maximum cost of storage investment for achieving a five-year payback period was €921 (AUD$ by applying optimum scheduling. In this study, a cold storage with a capacity of 99kWh, equipped with a polypropylene capillary tube heat exchanger and filled with 7000L of a commercial salty hydrate PCM with a melting point of 11°C, was examined.
Another recent theoretical study investigated the feasibility of ice storage systems for office building applications in various climates. The study considered a wide range of electricity tariffs, from 0.25 cent/kWh (off-peak) to 40 cent/kWh (peak) and found that the payback period for these systems is less than seven years. The study also concluded that as the base tariff increases and the ratio between the peak and off-peak electricity tariffs increases, the payback period for the ice storage systems decreases [9].
Ice is considered the best PCM to use in refrigeration applications. However, modern air conditioning system designs require chilled water at higher temperatures and a quick response to changes in air conditioning loads. There also requirements to minimise the peak energy demand to reduce energy cost or to facilitate the use of available renewable energy supply. Other issues associated with ice storage include the high cost of ice balls, challenges in controlling the flow of heat-transfer fluid and the requirement for extensive insulation to prevent heat loss. Moreover, fire risks, technical problems and underperformance have been reported in some storage systems, particularly those using outdated PCMs and a randomly designed heat exchange system using encapsulated PCM in balls [10, 11].
Many PCM storage systems have been suggested and trialled with little success. The major issues in the thermal energy storage sector are associated with heat transfer technology to achieve a sufficient charging or discharging speed [12]. While currently available commercial heat exchangers are designed for transferring heat from one fluid to another with high temperature differences, more advanced heat exchanger designs with higher heat transfer performance are required in TBs, as they need to exchange heat from a stationary solid/liquid PCM with low thermal conductivity [13].
In this regard, the prototype of the TB with 53.5kWh capacity was designed to overcome the limitations of the current thermal energy storage. The TB allows rapid cooling and discharging, and uses advanced heat transfer technology to achieve high heat transfer performance, enabling the use of salt-hydrate PCMs with melting temperatures of 15˚C. The TB being introduced in this paper builds on years of research/industry collaboration in developing PCM material technology, thermal battery design based on simulation, and experimental validation in response to specifications suggested by air conditioning design engineers.
This paper aims to evaluate the effectiveness of the TB when integrated with a conventional water chilled cooling system. The evaluation is conducted through the utilisation of a building simulation program, which allows for a comparison of electricity consumption and cost with and without the inclusion of the TB. Moreover, the study applies Australia’s time-of-use electricity pricing system to showcase the potential cost savings achievable through the implementation of the TB. By contributing to the expanding body of research on thermal energy storage systems, this paper endeavours to contribute to the advancement of energy efficiency and the reduction of energy costs in various applications.
Methodology
This section provides a detailed description of the methodology employed in this research. Firstly, it includes information on the PCM-TB, as well as a target integration model of the TB into a conventional building cooling system and the corresponding building model. Secondly, an economic analysis model is presented, which applies the time-of-use (ToU) electricity price used in South Australia. Finally, the analysis of the field test is presented.
Overview of the PCM-TB prototype
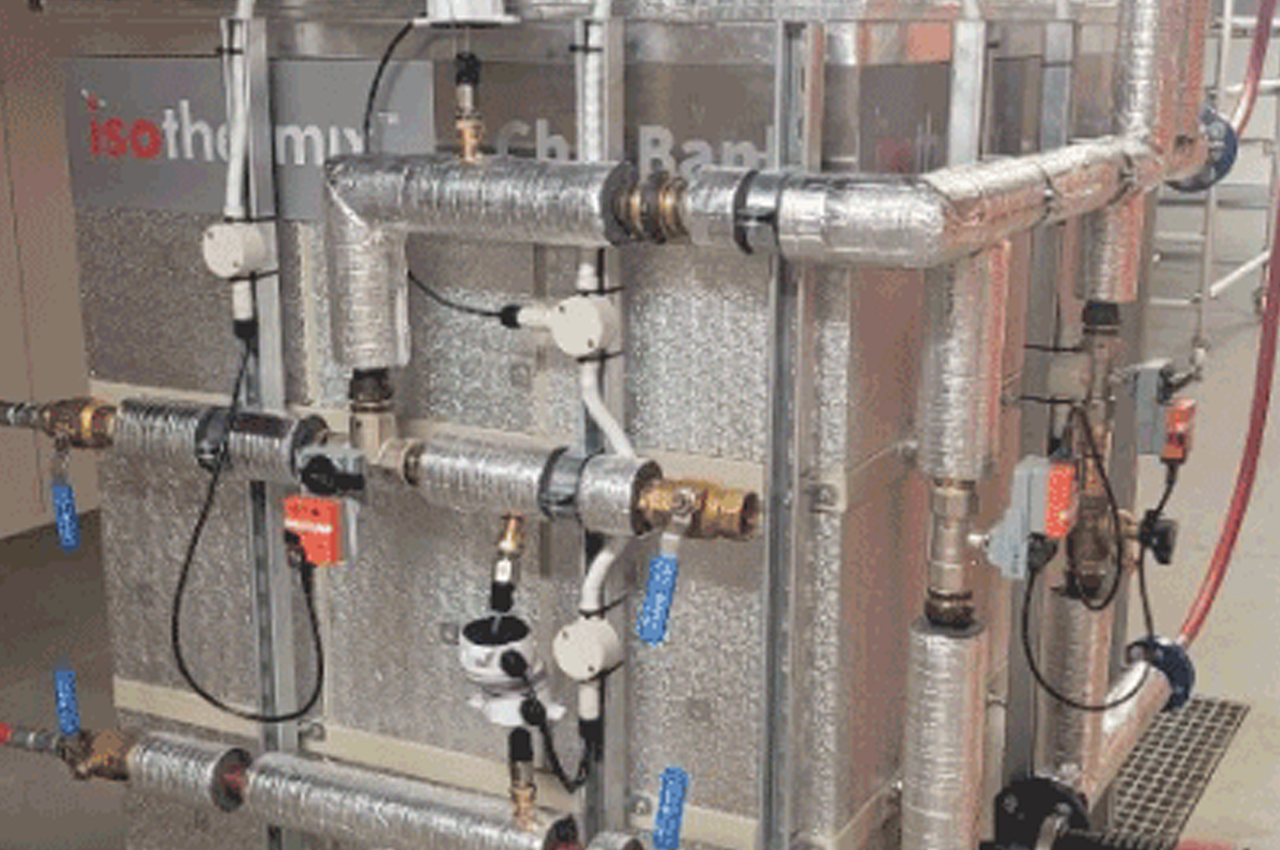
In 2019, with support from the Australia Industry Entrepreneurs’ Programme, a functional prototype of a TB was developed, drawing on over two decades of the University of South Australia (UniSA) research into latent heat (LH) thermal storage with PCM. The TB uses a newly formulated 15˚C PCM and an optimised TB design incorporating a shell and tube heat exchanger (HEX), as illustrated in Figure 1. The TB with a storage capacity of 53.5kWh is specifically designed to provide chilled water for air conditioning during peak demand periods.
The TB utilises a PCM that is formulated with a eutectic salt-hydrate material that has been verified by UniSA. To determine the appropriate ratio, PCT, specific heat capacity, and LH, various chemical compositions with water were tested using the differential scanning calorimetry (DSC) technique. The eutectic PCM, which has a PCT of 14~15°C and LH of 140 kJ/kg, was successfully synthesised. Additives were used to resolve the common issues, sub-cooling and phase separation, found in salt-hydrate PCMs. Moreover, the long-term stability of the PCM has been confirmed through over 200 repeated heating and cooling cycle tests. The PCM formulation is subject to patent protection under the Australian Provisional Patent Application No. 2023901684.
Integration of the PCM-TB into building cooling system
Figure 2 shows how the TB is integrated into a building cooling system (water chiller) with the flow circuits of the heat transfer fluid (HTF, water). The water circuit ①→④→⑤ represents the typical cooling process of the building cooling system using a water chiller. In this circuit, the water chiller cools the returned water, which has a temperature range from 21~26°C, and feeds 15°C chilled water back into the building. The TB is integrated into the cooling system, before the water chiller.
Return water from the building can either bypass the TB, or go through it when required. In this configuration, the temperature difference (delta T or ΔT) across the chiller is minimised, resulting in improved chiller performance. The water flow rate depends on the outlet water temperature (TO_PCM) from the TB. If the TO_PCM less than or equal to 15°C, the water flows ②→③; otherwise, the water flows ②→④→⑤. The water circuit ⑥→⑧ indicates the charging flow for the TB when the electricity price is low (e.g., during nights, or low tariff). For charging the TB, the water chiller supplies 7~9˚C water.
The coefficient of performance (COP) of a water chiller exhibits significant dependence on factors such as the ΔT across the water chiller, flow rate, and the outdoor ambient temperature during operation. Particularly, when the inlet water temperature and flow rate remain constant, it is advantageous to charge the TB during night-time hours when the outdoor ambient temperature is lower. This strategic timing promotes enhanced performance and energy efficiency, optimising the system’s overall effectiveness.
Building model
A building model, corresponding to the integration model as depicted in Figure 2, was prepared in order to evaluate the techno-economic benefits of the coupling of the TB with the building cooling system. For this simulation, two water chillers with a cooling capacity of 35kWh were used, and the parameters obtained from the product specification were applied to the air-cooled water chiller component (type 655) provided in the software package.
The additional power required by the water pump during the charging and discharging processes of the TB was estimated based on the flow rate and an 18m header length, as determined through the field test.
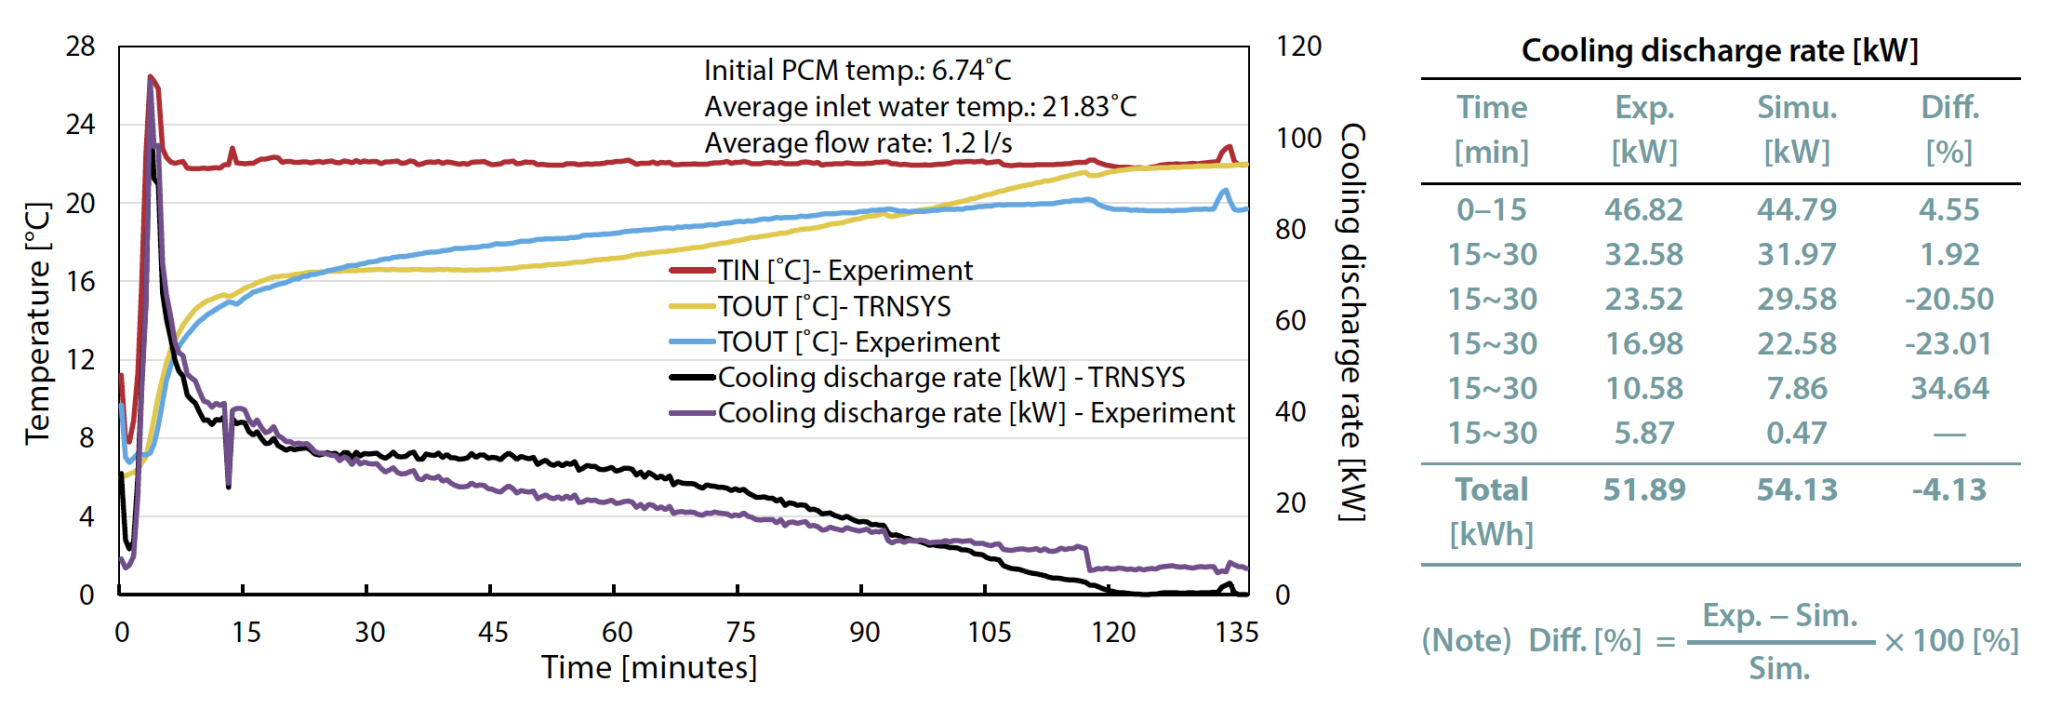
The TB component utilised in this simulation was developed and validated by UniSA [14, 15]. The design of the TB was meticulously created based on a parametric investigation of the component. As depicted in Figure 3, a discharging process was compared between simulation results and experimental data. The simulation demonstrated a 96% accuracy in predicting the cooling performance of the TB when compared to the experimental data. To ensure a fair comparison, the simulation utilised the same inlet water temperature, inlet water flow rate, and initial PCM temperatures obtained from the experiment.
The observed building cooling load data and weather data used in the simulation were obtained from a building located in Adelaide, South Australia, over a period from June 2020 to May 2021. Based on the data observed in Figure 4, the analysis of the cooling load reveals that the building cooling system was in use for a total of 324 days. The average daily cooling load during this period was 515kWh.
Notably, the month of January recorded the highest cooling load, with a peak of 1,530kWh, while the lowest load of 49kWh was observed in June. Additionally, examining the hourly cooling load during the discharging period, it was found that the maximum recorded hourly cooling load reached 176kW. The most frequent range of cooling load values occurred between 59 to 69kW, which appeared 146 times. The ToU electricity tariffs used in the simulation were obtained from an electricity retailer. The off-peak price was 14.43 cent/kWh, while the peak price was 40.52 cent/kWh.

Economic analysis model
The economic viability of TBs is a crucial factor to consider when assessing their feasibility. In order to evaluate the economic potential of a building cooling system with the integration of a TB, several financial indicators were employed, including the payback period, internal rate of return (IRR), and net present value (NPV) methods.
The payback period serves as a commonly utilised metric for assessing the economic benefits associated with a TB. However, it is important to note that simple payback period calculations do not account for variables such as interest rates and fluctuations in electricity prices. Consequently, in this study, a dynamic payback period method (2) was adopted, incorporating statistical data from the past decade to account for variations in interest rates and electricity prices. This approach leads to a more realistic and rational evaluation of the economic benefits of a TB.


The internal rate of return (IRR) is a financial metric that represents the discount rate at which the net present value (NPV) of a project becomes zero (1) and (2), indicating the anticipated compound annual rate of return expected from a specific project or investment. In this study, it is crucial to acknowledge that the benefits obtained from the project, such as changes in electricity prices, have consistently exhibited an upward trend over time. Therefore, this trend should be appropriately reflected in the IRR method.
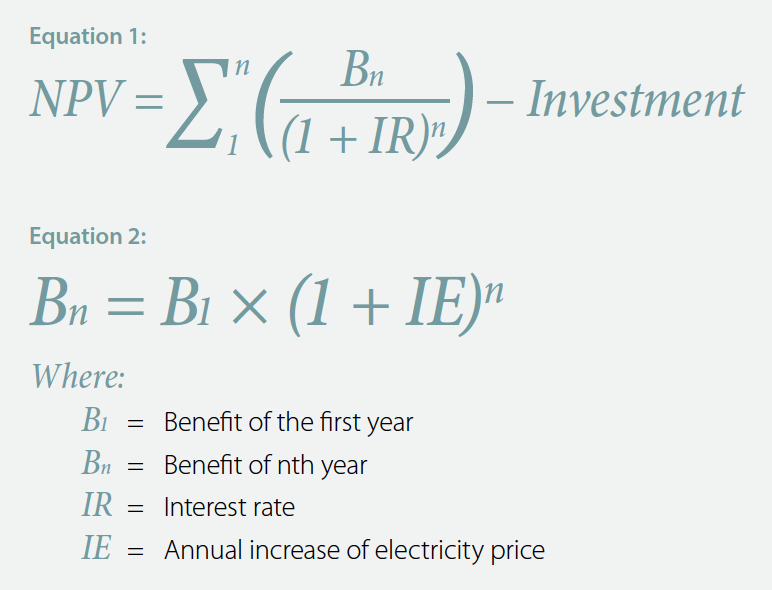

Empirical evidence presented in Figure 5, based on research conducted by the Australian Energy Regulator (AER), illustrates a significant increase of 2.4 times in wholesale electricity prices in Australia over the past decade, indicating an average annual growth of approximately 9.0% [18]. Meanwhile, the average interest rate in Australia over the same period was recorded as 1.74% [17], and the inflation rate stood at 2.63% [16].
Method for field test analysis
For field testing, two units of the TB were installed at the Pawsey Supercomputing Centre (PSC) and UniSA lecture theatre, commencing the testing process. The PSC, operated by the Commonwealth Scientific and Industrial Research Organisation (CSIRO) and a consortium of Australian universities, serves as a national high-performance computing and data centre.
Located in the suburb of Kensington, approximately 6km south-east of Perth’s central business district, the PSC enjoys a Mediterranean climate characterised by hot, dry summers and cool, wet winters. Similarly, the UniSA lecture theatre building is situated in the suburb of Mawson Lakes, about 15km north-east of Adelaide’s city centre, and also has a Mediterranean climate.
In the field test, it was observed that the capacity of the TB accounted for less than 5% of the total cooling capacity of the buildings. As a result, the impact of the TB on electricity consumption and cost savings was not noticeable based on the field test results. Consequently, the integration of the TB at each site will need to be investigated separately, taking into account the specific objectives.
At the CSIRO site, the TB was utilised to reduce deviations in feeding water temperature to the data centre, while in the UniSA lecture theatre, it was installed to assess the TB’s capability to handle the 15-minute cooling peak at the beginning of lectures. However, the analysis presented in this study solely relies on the results obtained from the CSIRO site as the unit installed at UniSA is currently undergoing testing and is not included in the analysis at this stage.
Results and discussion
This section presents the results of an evaluation on the performance and economic benefits of integrating the TB into a building cooling system. The test period was from June 2020 to May 2021, and the results showed significant improvements in the efficiency of the cooling system, particularly during peak periods. The integration of the TB resulted in substantial electrical and peak demand savings, as well as increased COP values for the cooling system. Additionally, the economic analysis demonstrated potential cost savings and a viable payback period for the TB. The field test carried out at the PSC in Australia confirmed its positive impact on maintaining consistent water temperature and optimising the operation of the data centre.
Electrical demand saving and peak load shift
Figure 6 illustrates the annual electrical and peak demand savings obtained from the TRNSYS building simulation during the period from June 2020 to May 2021. Note that the peak period was defined as between 06:00 and 22:00, and off-peak was defined as 00:00 to 06:00 and 22:00 to 24:00. Without coupling the PCM-TB, the cooling system consumed 23,876kWh during the peak period, while it only required 4,089kWh during the off-peak period.
On the other hand, the cooling system coupled with the TB demanded only 20,113kWh during peak period by shifting 2,717kWh to the off-peak period and saving 1,045kWh, as shown in Figure 6 (a). The annual total electrical demand in each hour, as depicted in Figure 6 (b), clearly demonstrates how the electrical demand during the peak period was shifted to the off-peak period. Charging start time was adjusted between 00:00 to 04:00 in order to distribute charging demand during the off-peak period. Discharging for cooling begins when the maximum cooling demand of each day occurs, which is typically between 10:00 to 18:00.
The incorporation of the TB has shown a significant increase in the efficiency of the cooling system, particularly during peak periods. Notably, on the day of maximum cooling demand during peak hours, the COP of the cooling system was observed to be around 4.3. However, with the integration of the TB, the COP was observed to double, resulting in a significant reduction in energy consumption and alleviating stress on the cooling system. This demonstrates the significant contribution of the TB towards enhancing the performance of the cooling system during peak periods.
Temperature difference between inlet and outlet water is a key factor affecting the COP of cooling systems, with a greater difference resulting in a lower COP. To optimise the COP, minimising the temperature difference between the indoor and outdoor air is critical. Additionally, the COP of a cooling system can be affected by ambient temperature, with a decrease observed as ambient temperature increases, requiring more energy to remove heat from the air and resulting in lower efficiency.
Figure 7(a) depicts the COP of the water chiller during the off-peak period, with and without the integration of the TB. Specifically, the cooling load observed between 00:00 and 01:00 is examined. When the water chiller operates alone, it achieves a COP of 6.61 while reducing the inlet water temperature from 22°C to 15°C at an ambient temperature of 21.5°C. However, when the water chiller is coupled with the TB, its performance is impaired during this period because the water chiller must lower the inlet water temperature from 22°C to 9°C in order to charge the PCM simultaneously. Subsequently, as the return water temperature from the TB decreases, the COP of the water chiller increases. At the end of the charging process, the COP reaches slightly below 11.4°C.
Figure 7(b) demonstrates how the integration of the TB improves the efficiency of the water chiller during peak hours (16:00~19:00). During this time, the water returning from the building was between 24°C and 26°C. When the water chiller operated alone to reduce the return temperature below 15°C, the COP remained between 4.2 and 4.6. However, when coupled with the TB, the COP almost doubled during the first two hours and gradually decreased as the energy stored in the PCM was depleted. These results suggest that the integration of the TB can be an effective method for enhancing the efficiency of the existing cooling systems, particularly during periods of high cooling demand.
The simulation software used in the trial was TRNSYS (TRaNsient SYStem simulation program) building simulation.
To be continued in Part 2.
References
1. Faraj, K., et al., A review on phase change materials for thermal energy storage in buildings: Heating and hybrid applications. Journal of Energy Storage, 2021. 33: p. 101913.
2. Heier, J., C. Bales, and V. Martin, Combining thermal energy storage with buildings – a review. Renewable and Sustainable Energy Reviews, 2015. 42: p. 1305-1325.
3. Vega, M., et al., Life cycle assessment of the inclusion of phase change materials in lightweight buildings. Journal of Energy Storage, 2022. 56: p. 105903.
4. Nijmeh, S., et al., A Technical and Economic Study of a Photovoltaic–phase Change Material (PV-PCM) System in Jordan. Jordan Journal of Mechanical and Industrial Engineering, 2020. 14: p. 371-379.
5. de Gracia, A., et al., Life Cycle Assessment of the inclusion of phase change materials (PCM) in experimental buildings. Energy and Buildings, 2010. 42(9): p. 1517-1523.
6. Yang, L., et al., A comprehensive review on sub-zero temperature cold thermal energy storage materials, technologies, and applications: State of the art and recent developments. Applied Energy, 2021. 288: p. 116555.
7. Erdemir, D., N. Altuntop, and Y.A. Çengel, Experimental investigation on the effect of ice storage system on electricity consumption cost for a hypermarket. Energy and Buildings, 2021. 251: p. 111368.
8. Tan, P., et al., Thermal energy storage using phase change materials: Techno-economic evaluation of a cold storage installation in an office building. Applied Energy, 2020. 276: p. 115433.
9. Rahgozar, S., et al., Economic feasibility of ice storage systems for office building applications: A climate sensitivity analysis. Journal of Energy Storage, 2022. 45: p. 103712.
10. Aschberger, E., PCM Operational Report. 2003, Melbourne City Council
11. Alam, M., et al., Energy saving performance assessment and lessons learned from the operation of an active phase change materials system in a multi-storey building in Melbourne. Applied Energy, 2019. 238: p. 1582-1595.
12. Al-Mudhafar, A.H.N., A.F. Nowakowski, and F.C.G.A. Nicolleau, Enhancing the thermal performance of PCM in a shell and tube latent heat energy storage system by utilizing innovative fins. Energy Reports, 2021. 7: p. 120-126.
13. Yu, S., et al., Bio-based PCM/carbon nanomaterials composites with enhanced thermal conductivity. Solar Energy Materials and Solar Cells, 2014. 120, Part B: p. 549-554.
14. Liu, M., et al., Design of sensible and latent heat thermal energy storage systems for concentrated solar power plants: Thermal performance analysis. Renewable energy, 2019: p. 1-12.
15. Tay, N.H.S., et al., Chapter 7 – Static Concept at University of South Australia, in High Temperature Thermal Storage Systems Using Phase Change Materials, L.F. Cabeza and N.H.S. Tay, Editors. 2018, Academic Press. p. 157-191.
16. O’Neill, A., Australia: Inflation rate from 1987 to 2028. 2023: Australia.
17. Australia, R.B.o., The Australian Economy and Financial Markets; Chart Pack. 2023: Australia. p. 20.
18. AER, Chapter 2 – National Electricity Market, in State of the energy market 2022, A.E. Regulator, Editor. 2022: Australia.
19. Energy, D.o. Heating, Ventilation, and Air Conditioning (HVAC). Residential Program Guide 2023 [cited 2023 11th May]; Available from: https://rpsc.energy.gov/tech-solutions/hvac.

This article appears in Ecolibrium’s May 2024 edition
View the archive of previous editions
Latest edition
See everything from the latest edition of Ecolibrium, AIRAH’s official journal.
