Aligning maintenance approaches across BMS and mechanical systems


AIRAH’s Big Data and Analytics STG makes the case for integrating data-driven maintenance to ensure our buildings work smarter, not harder.
You can spend hundreds of thousands of dollars on a shiny new Ferrari, but if you don’t look after it properly, it’ll soon feel like you’re driving a 1984 Nissan Sunny.
The same applies to commercial HVAC. Even a state-of-the-art HVAC system is only as good as its regular maintenance.
Maintaining building HVAC & control systems makes buildings:
- Safe to work in and occupy
- Comfortable to be in
- Commercially viable.
Unfortunately, as an industry, we don’t do this nearly as well as we should.
Let’s take a closer look at how the HVAC industry has typically approached maintenance, how technology is changing the game, and why it’s worth making the switch.
Maintenance methodologies
We see four common approaches to HVAC system maintenance in commercial buildings:
- Planned preventative maintenance (PPM) –routinely checking specific equipment, often on a 12-month cycle
- Condition-based maintenance – inspecting and maintaining equipment based on its age and condition
- Reactive maintenance – responding to an equipment breakdown or complete system failure
- Data-driven maintenance (DDM) – proactively addressing problems using system data and analytics.
The most common of these approaches is planned preventative maintenance (PPM). Let’s take a detailed look at how this approach currently works.
The traditional model: PPM
PPM models are the industry norm and still dominate the market. These models see maintenance staff perform time-intensive tasks that don’t actually improve the building’s comfort or performance.
These tasks typically involve workers interrogating graphics and trend logs, only to fill out check sheets for maintenance records. These checks become repetitive, and the potential for human error means issues are often missed.
Because these processes are so time-consuming, maintenance procedures have adapted to typically only check equipment operation once a year, and only certain pieces of equipment every month. This means problems could go unchecked until month 12 of the maintenance contract.
Another crucial flaw of PPM is that, when staff do this manually, they typically only interrogate a couple of days’ worth of data in scanning for any potential issues. This means they might overlook issues that aren’t apparent from that small data sample, but that continue to cause major problems for the building.
Here’s how a PPM approach falls short in three key areas of HVAC building services: air handling units (AHUs), variable air volume (VAV) boxes, and building management systems (BMS).
Added complexity
This split can introduce a degree of subjectivity when evaluating productivity – particularly in determining how analytics-related time is measured, how task completion is defined, and what constitutes work beyond the allocated analytics hours. However, once these elements are clarified and aligned across delivery teams, the resulting efficiencies and overall service flow can significantly surpass those of traditional maintenance approaches.
Air handling units (AHUs)
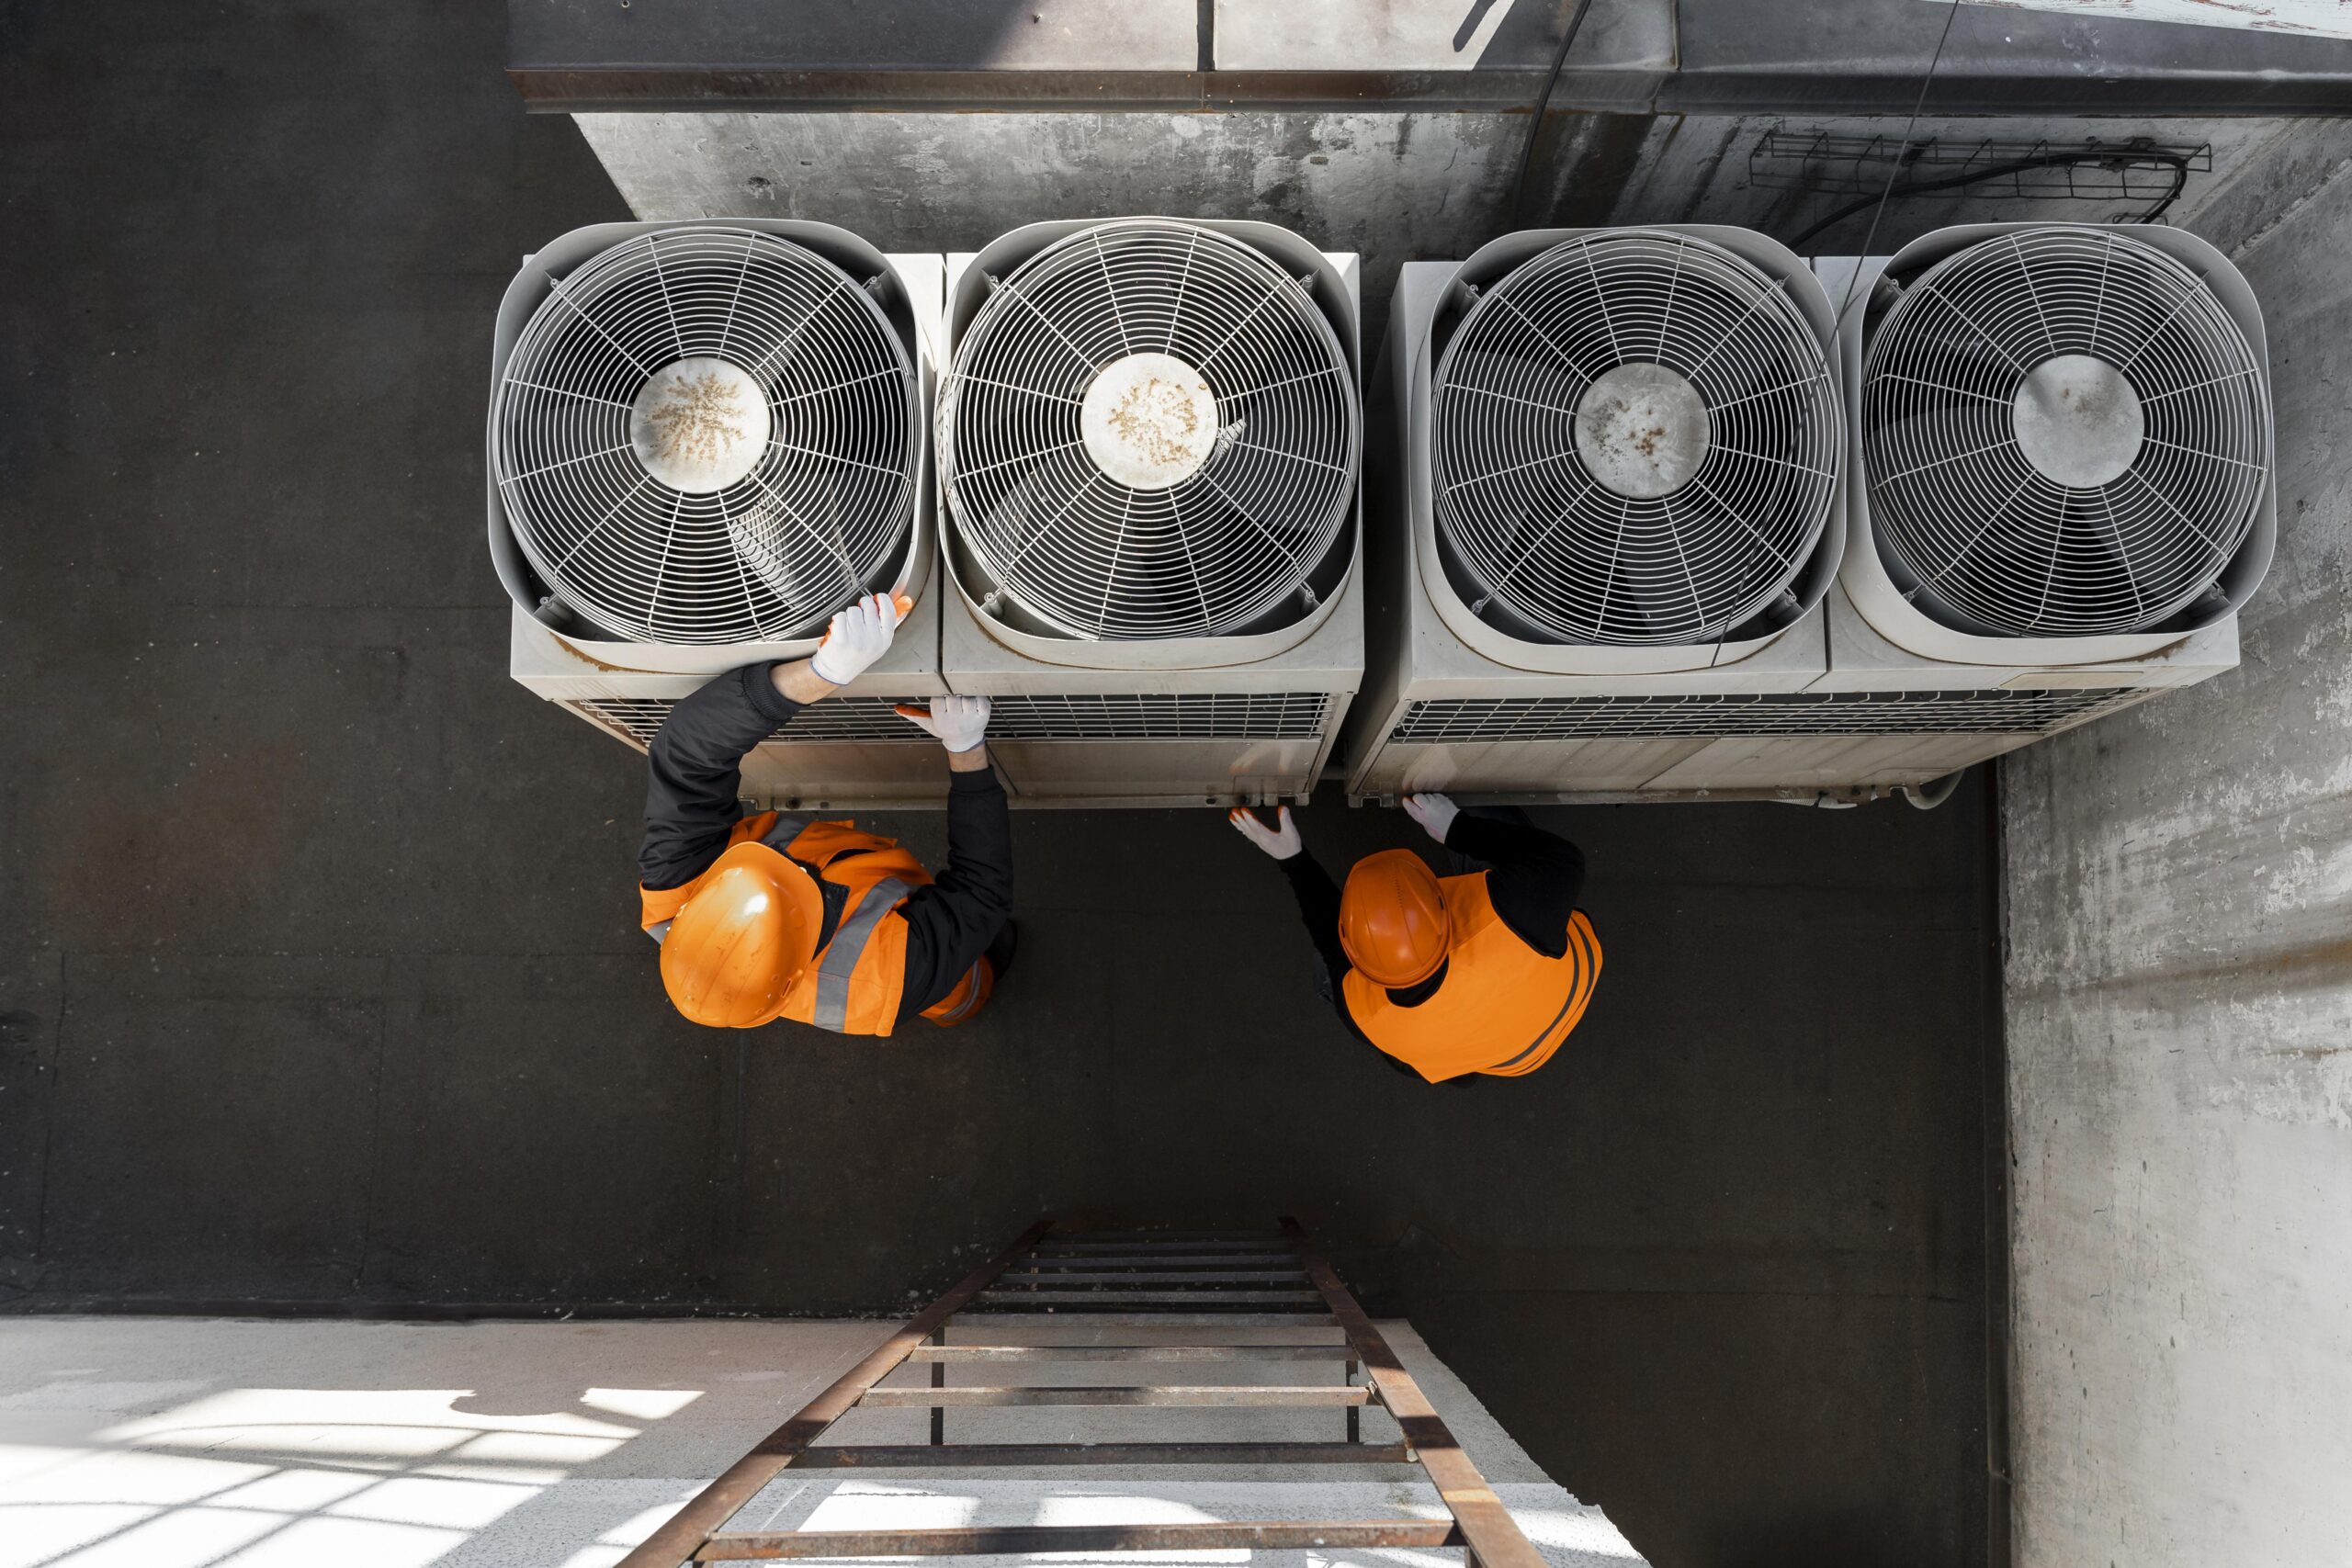
In a PPM model for AHUs, technicians typically attend site, visually inspect components like condensate drains/trays, filters, belts, dampers, and coils, and check for obvious signs of blockage, wear, or failure.
A technician might listen for unusual noises, feel for temperature differences, physically measure pressure differentials, or briefly run the equipment in manual mode to simulate different conditions such as full load to check for irregularities. But this hands-on check typically happens only once a month or quarter, meaning issues such as chilled/heating hot water valves passing or volume dampers jamming/not closing properly between visits are easily missed. With a PPM approach, these faults often continue to cause major problems after the technician has finished their inspection.
In many cases, problems are only addressed once comfort complaints arise or performance noticeably drops. And because inspections are periodic, it’s possible for faults like fan imbalance, damper sticking, or coil fouling to go undetected for weeks or months. During that time, energy efficiency drops, wear accelerates, and occupant comfort suffers.
Variable air volume (VAV) boxes
Now let’s take a simple VAV box maintenance procedure. Using a PPM approach, staff would perform the following:
- Look at a BMS graphic to check the following:
- Airflow reading – is it reading zero? How close is it to the set point?
- Zone temperature – is it reading open or closed circuit? How close is it to the set point?
- Damper position – is it modulating to maintain the airflow set point?
- Check that the airflow set point responds to a change in room temperature
- Drive damper actuators open and closed to check if airflow increases and decreases
- Interrogate room temperature trend logs to check how close to set point they operate
- Interrogate airflow trend logs to check how close to the set point they operate.
Only once they’ve identified any issues using this method will the maintenance technician physically check the VAV unit and rectify the problem. This manual interrogation of system operation is very time-consuming; the above checks would take a technician 5–10 minutes per VAV to perform. This starts to add up very quickly when there are hundreds of units to check (100 VAVs = 8–16 hours).
Building management systems (BMS)
A PPM approach for a building management system (BMS) typically involves arriving to site, checking the system’s operation by looking at the graphical interface, and maybe manually manipulating the system to test functionality. All too often this only happens on a single day every month or quarter, meaning only problems that are apparent on the day are rectified.
Not only are these tasks labour-intensive, but they don’t actually improve the building’s performance. It’s not until the underlying issue is rectified that the building performs better.
Moving beyond PPM
Designing a maintenance plan for a building involves identifying the most efficient and effective maintenance methodology to achieve the best outcomes. PPM preventative maintenance tasks have their place; however, they’re no longer alone sufficient to support our ambitions for the built environment.
That’s where the relatively new technology of fault detection and diagnostic (FDD) systems come in. FDD systems functionally test equipment throughout its normal operation and identify issues as they occur. This allows the maintenance team to focus on fixing problems instead of looking for them. Using this approach, technicians spend less time onsite and can dedicate that time to fixing the worst performing items of equipment, rather than dull and repetitive work.
FDD is key to integrating a data-driven maintenance model, allowing the plant to operate as it was designed to with all systems working in sync. This results in lower energy consumption, better thermal comfort for tenants, and improved indoor air quality.
Data-driven maintenance in action
If we take the earlier VAV example and apply a data-driven maintenance model to it, the maintenance staff would perform the following:
- Log in to the analytics system to check for any VAV faults.
- Check VAV KPI reports to identify the worst performing VAVs based on room temperature and airflow.
The above tasks would take roughly 5–10 minutes to perform for all VAVs onsite. If we compare this to the 5–10 minutes per VAV it would take to use a PPM approach, we can see massive savings in both employee time and expense. The data-driven approach also means that issues are identified and fixed as they occur, not as the system is checked (potentially only once every 12 months).
Together in harmony
Data-driven maintenance works brilliantly for components like VAVs; there might be hundreds of VAVs in a commercial building, and physically inspecting all of them is very time-consuming. But what about more substantial components of a building’s HVAC system that still require regular PPM inspections?
Let’s now look at how a complete plan – combining PPM tasks, all-the-time maintenance, and data-driven maintenance – would work in the case of an AHU.
PPM visual inspections
- Verify all safety guards are present, secure, and fit for purpose
- Inspect for loose or missing bolts, damage, corrosion, and general wear
- Visually inspect ductwork, air filters, coils, condensate pans, drainage lines, and T-joints for blockages and microbial growth (AS3666.2)
- Ensure all panels, doors, ductwork, flexible connections, and insulation are properly sealed when closed (AS3666.2)
- Confirm AHU chamber lighting is functional and compliant (AS3666.2)
- Check return/supply fans, belts, and pulleys
- Lubricate components where required.
All-the-time maintenance activity
Verify proper operation of chilled water (CHW) and heating hot water (HHW) valves
- Confirm damper functionality (return, fresh, economy air) and rule out manual override or hunting behaviour
- Assess the AHU’s ability to meet static pressure setpoint via fan performance and damper response
- Check supply air temperature control by evaluating valve and loop temperatures
- Inspect filter condition and determine optimal replacement timing
- Check static pressure sensor accuracy; flagged for calibration if required
- Verify CO₂ sensor readings (if installed)
Ensure AHU is not running outside scheduled hours.
Data-driven maintenance
- Check the chilled water valve that is passing
- Check the AHU chilled water coil that is starving
- Check the economy damper that is passing/leaking air.
Tips for switching to data-driven maintenance
Under a DDM regime, there will be an allocation of time for HVAC & BMS technicians to deal with data-driven insights. Before implementing DDM, the facility owner should identify the metrics they will use to measure DDM performance, preferably in consultation with an experienced vendor.
Common metrics include:
- Energy reduction
- Quantity and quality of insights closed
- Reduction in breakdown calls.
The following information is helpful when transitioning to a DDM:
- HVAC asset list, including which units are connected to the BMS and which aren’t
- BMS make, model, functional description, protocols and architectures
- BMS connectivity – is it connected directly to the internet, or via the site’s VPN infrastructure?
Nett lettable area of the building – in some instances this can be used to benchmark the cost of implementation
Understanding of the quality of the asset (historical PPM spend vs breakdown spend).
Proof in the pudding
The winning formula involves integrating building analytics/FDD into a complete and coherent maintenance program that combines physical and digital resources. This removes overlaps and gaps, augments maintenance activity, and gives technicians superpowers.
Below, we’ve compiled some data that shows rolling energy consumption before and after integrating data-driven analytics into a comprehensive maintenance model across several sites. In these examples, the energy consumption dropped around 14% on average just by targeting the worst performing equipment.
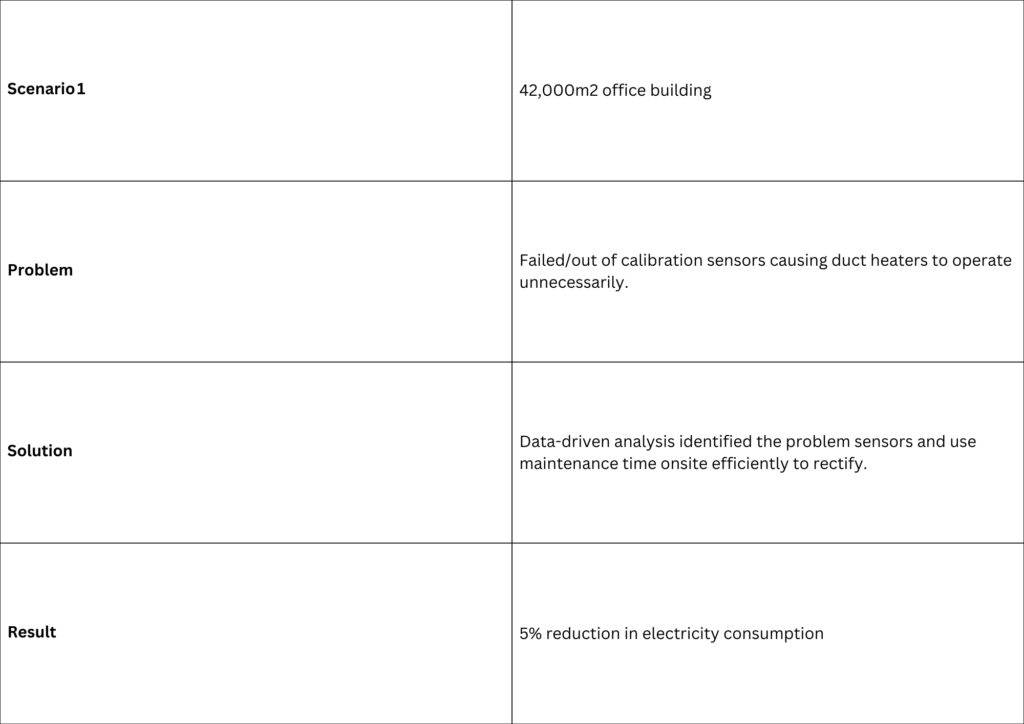
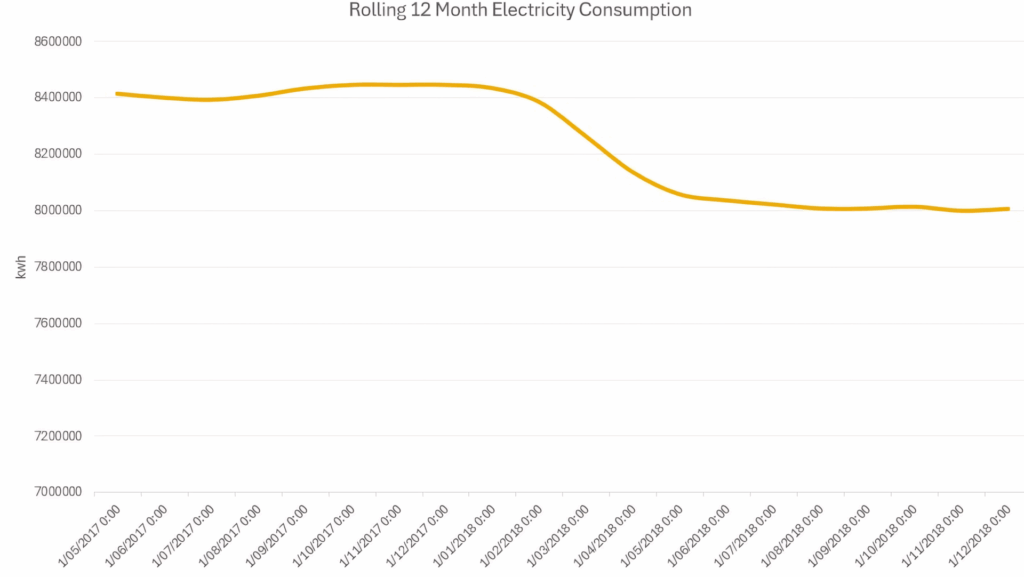
Scenario 1: Electricity consumption before and after DDM implementation
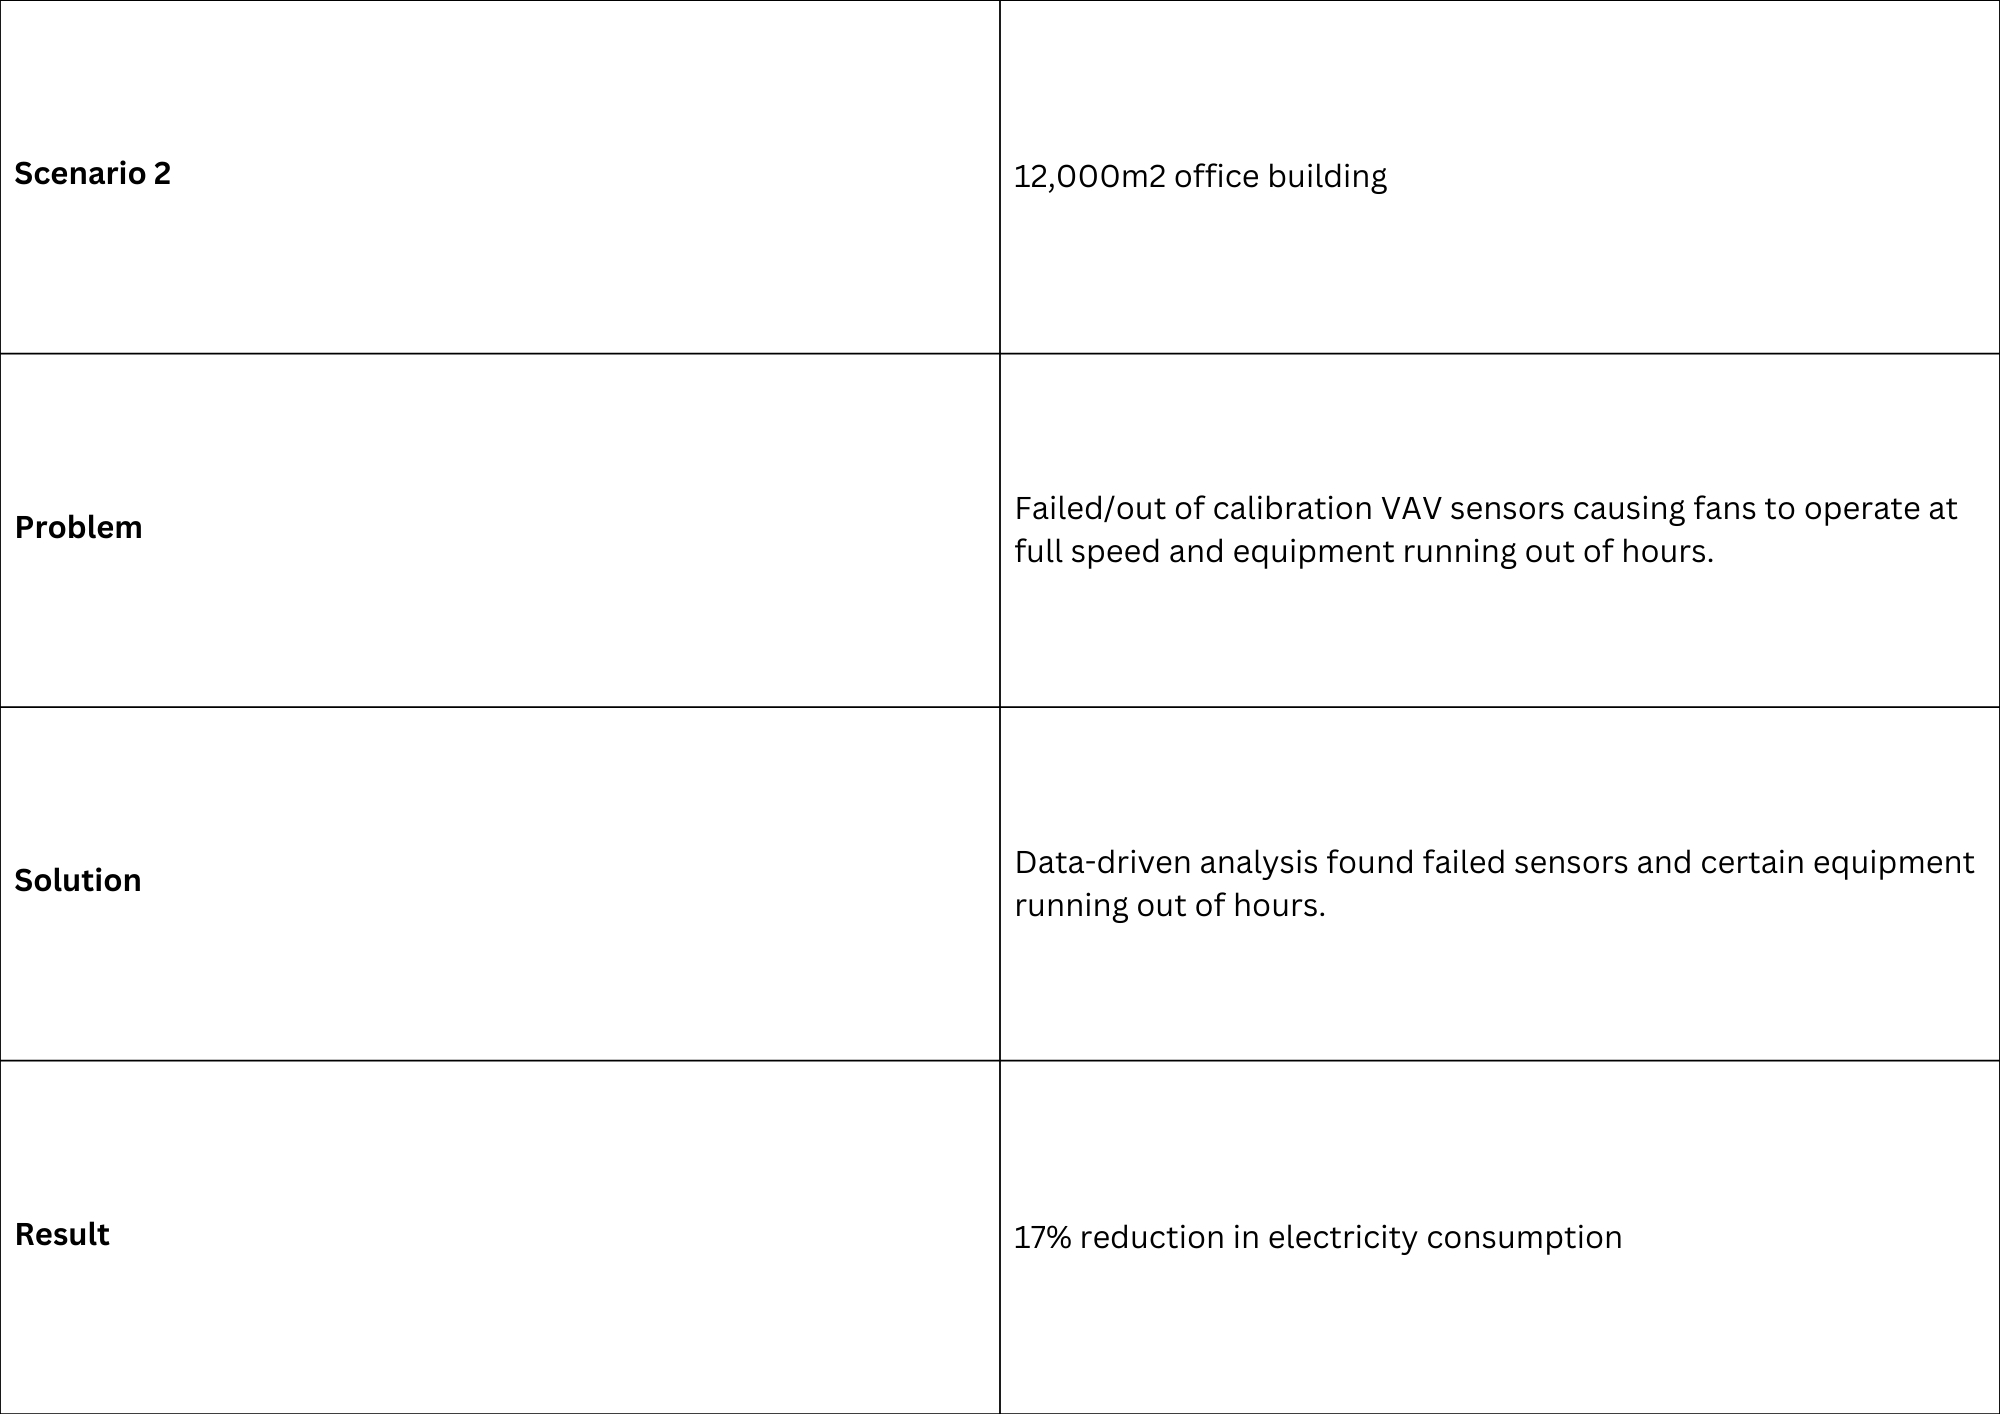
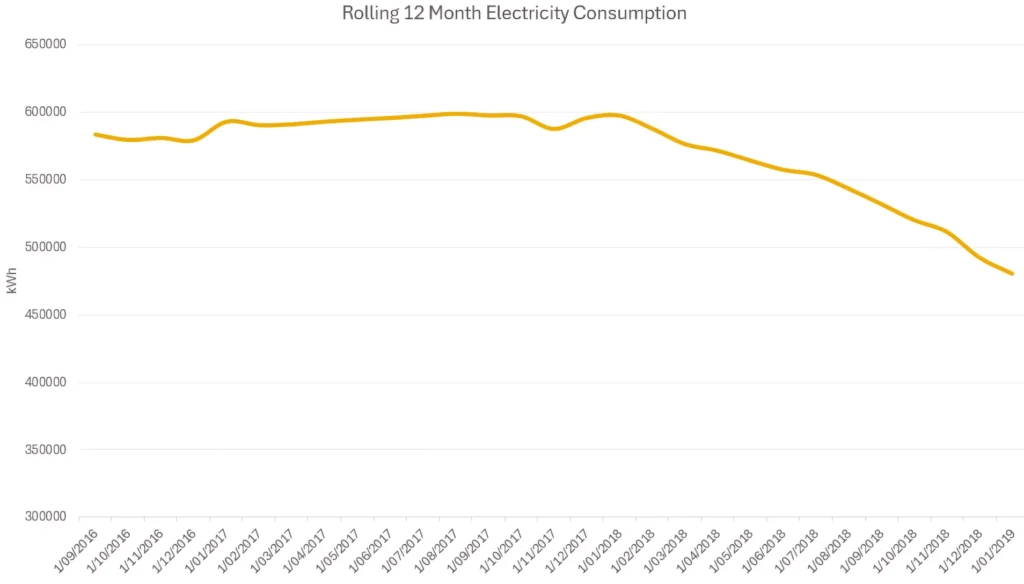
Scenario 2: Electricity consumption before and after DDM implementation
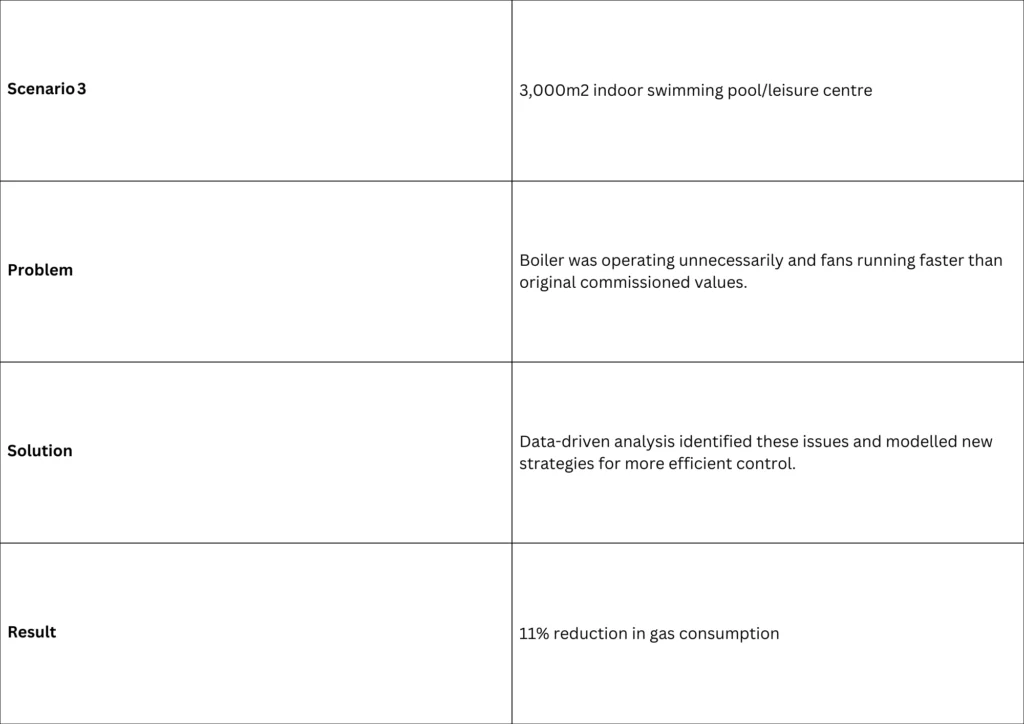
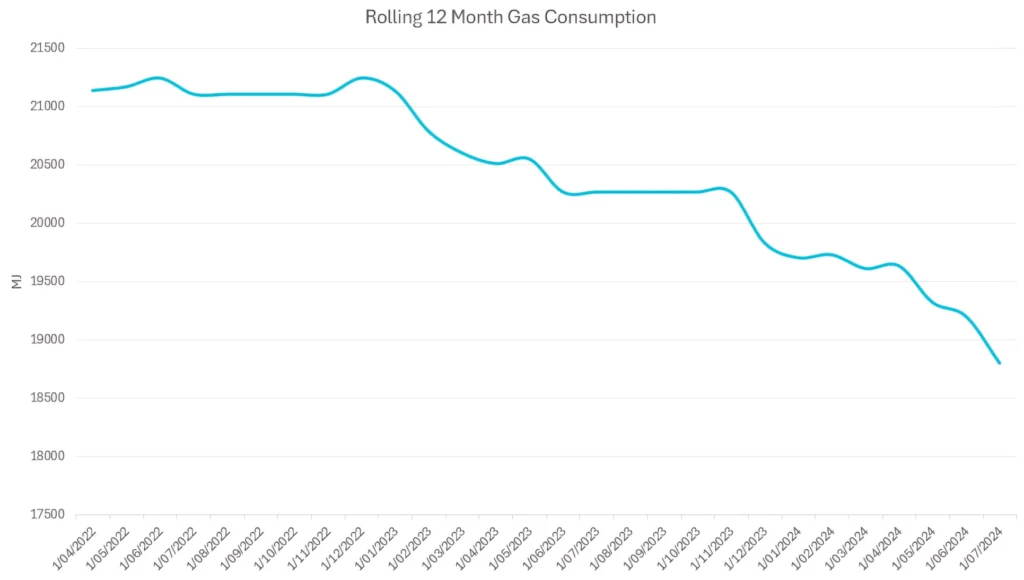
Scenario 3: Gas consumption before and after DDM implementation
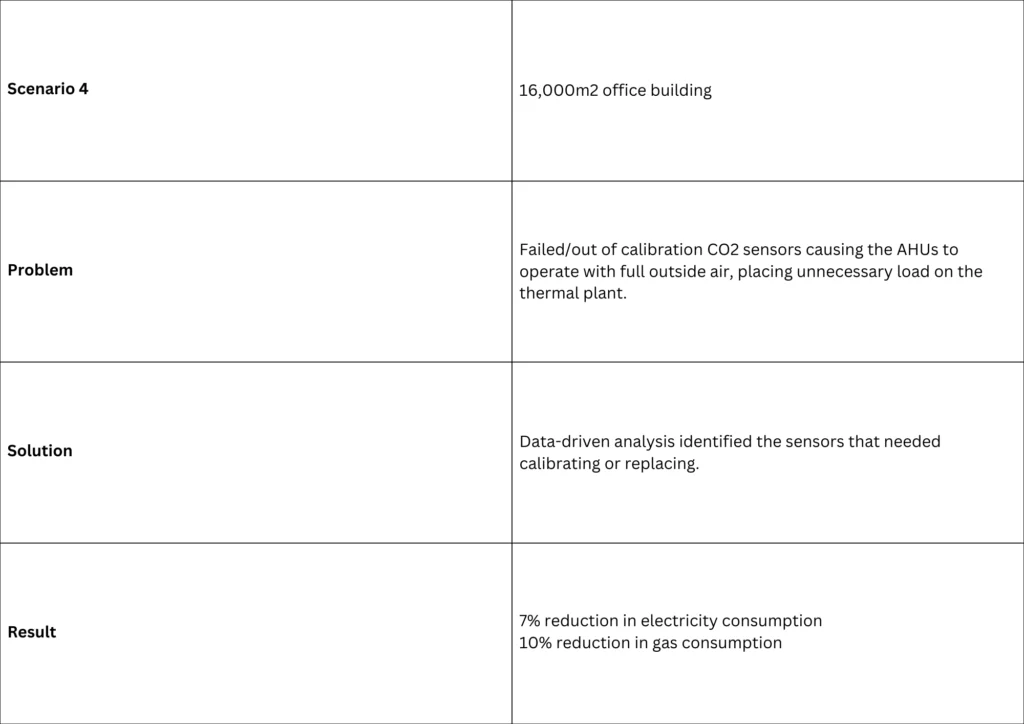
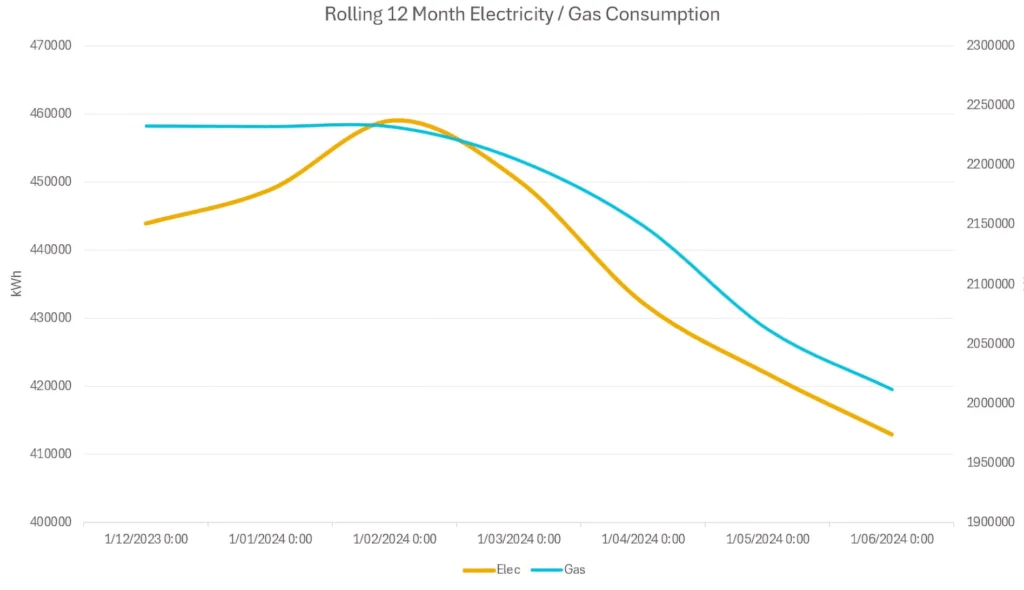
Scenario 4: Electricity/gas consumption before and after DDM implementation
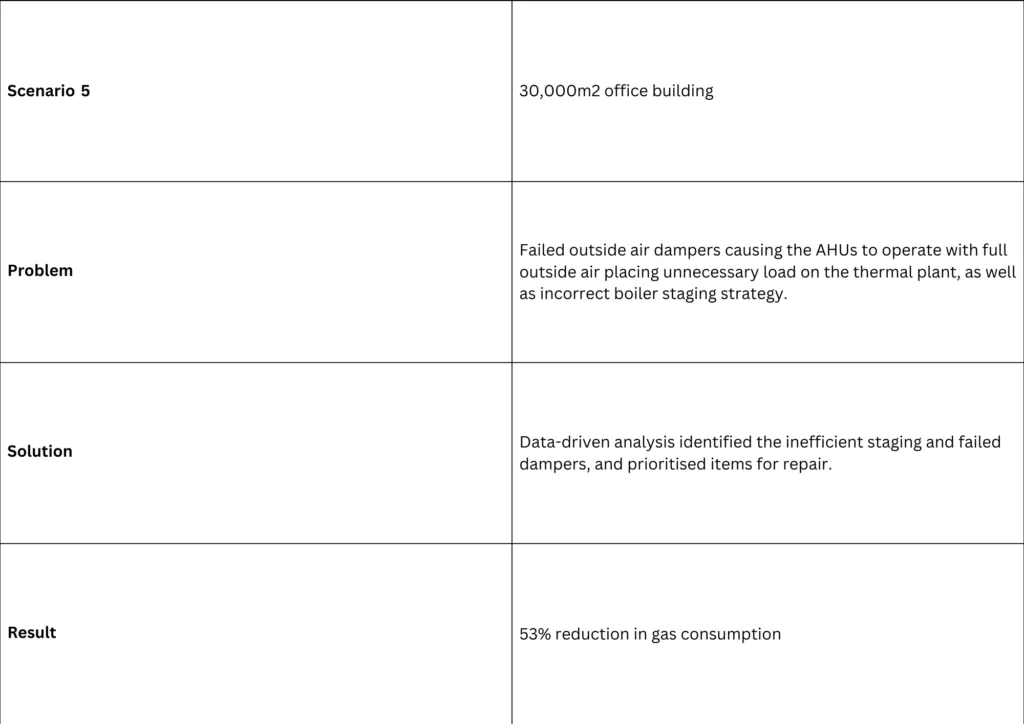
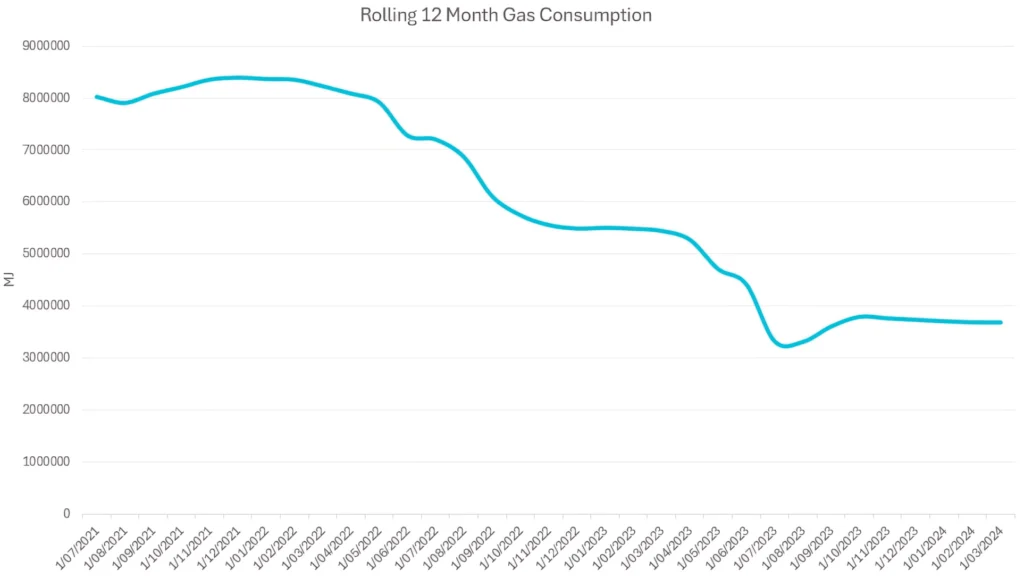
Scenario 5: Gas consumption before and after DDM implementation
Conclusion
The evidence is clear: integration data-driven analysis into a comprehensive maintenance strategy saves time, money, and energy, while improving outcomes for building managers, occupants, and maintenance technicians.
So, if you paid Ferrari money for your building’s HVAC system but are getting 1984 Sunny results, you know what to do.

Chris Stamatis, Roshan Gill, and Sean O’Shaughnessy (left to right)
AIRAH’s Big Data and Analytics STG
Chris Stamatis, Roshan Gill, and Sean O’Shaughnessy are all members of AIRAH’s Big Data and Analytics Special Technical Group (STG). The STG brings together professionals to better understand issues, identify what needs to be done, and collaborate on combined efforts to move the industry forward when it comes to proactively controlling and optimising building HVAC&R systems.
To learn more about the STG, or to submit an application to join the group, email [email protected].

This article appears in Ecolibrium’s Spring 2025 edition
View the archive of previous editions


Latest edition
See everything from the latest edition of Ecolibrium, AIRAH’s official journal.