CFD Analysis of Fixture Output Impact on Upper Room Germicidal Ultraviolet Light System Performance

Ultraviolet germicidal irradiation (UVGI) using electromagnetic radiation in the UV‑C wavelength band of 200–280nm can prevent the reproduction of microorganisms. Several factors related to UV fixtures, HVAC layout and the resulting airflow flow patterns can affect the performance of upper‑room UVGI applications. Using computational fluid dynamics (CFD) analysis, this study systematically evaluated the impact of UV‑C intensities on the effectiveness of an upper room UVGI system, showing that adding even a small amount of UV‑C energy in the upper region of room space can significantly reduce the probability of infection as predicted by the WellsRiley model. Increasing the UV‑C output shows a further reduction in the infection probability, although with a diminishing impact. The second part of this study will evaluate the effect of airflow patterns on the performance of UVGI systems. This work demonstrated that CFD analyses can help optimize the performance of UVGI systems to minimize the probability of infection in indoor spaces.
Introduction
Ultraviolet germicidal irradiation (UVGI) using electromagnetic radiation in the UV-C wavelength band of 200–280nm can prevent the reproduction of microorganisms such as viruses, bacteria, and fungi in air and water and on surfaces.1 Upper-room UVGI, in which UV-C generating fixtures create a disinfection zone in a space above the occupied zone, has been employed successfully in schools to reduce the spread of measles and other contagious childhood diseases and in health-care facilities to inactivate tuberculosis (TB) bacteria in isolation rooms and TB wards and to control transmission of nosocomial infections.2,3 The COVID-19 pandemic created a renewed interest in upper-room UVGI systems, which were introduced in the 1930s, to control the transmission of the SARS-CoV-2 virus. Wall or ceiling-mounted UV-C fixtures using, in the current generation of source technology, mercury vapor or amalgam lamps generate a UV-C field with 254nm UV-C. Mixing airflow patterns in the space helps carry infectious aerosols into this UV-C radiation field where microorganisms are inactivated. The rate of inactivation depends on type of microorganism, UV-C intensity and the duration of exposure to the UV-C field.3,4
To reduce the occupants’ exposure to hazardous UV-C radiation, the UV-C radiation is directed horizontally or toward the ceiling. Microbial susceptibility to UV-C and the delivered UV-C dose, which is the product of UV-C fluence and the residence time of the microbes in the UV-C field are the most important factors affecting the efficacy of upper room UVGI systems. Several factors can affect the performance of upper-room UVGI systems. The location and type of UV-C fixtures, fixture UV-C output and the UV-C reflective characteristics of adjacent objects such as walls, ceiling, and other ceiling-mounted diffusers can affect the UV intensity distribution in the space. Additionally, indoor airflow patterns play a crucial role in determining the flow path of airborne pathogens and their residence time in the upper UV-C field, which in turn determines the effective kill rate of microorganisms.
Airflow patterns and their effects on the distribution of aerosols depend on several factors including the number, location and type of supply diffusers in space; supply airflow rates (air change rates) and associated diffuser throws; supply air temperature; number, size and locations of return/exhaust grilles; the location and strengths of various heat sources in a room; an arrangement of furniture and other obstructions to airflow; location, type and capacity of air mixing devices such as ceiling fans; and importantly, the relative positions of sources of aerosols in space. Strategic selection and layout of supply diffusers and exhaust grilles combined with appropriate size and capacity of UV-C fixtures can help optimize the UVC dose for effective inactivation of microorganisms.5
This study employed CFD simulations to systematically evaluate the impact of UV-C intensities on the effectiveness of an upper room UVGI system. The survival fraction of microorganisms and the resulting probability of infection was computed for a representative office space by keeping the ventilation rate and HVAC configuration (the location and type of supply diffuser and return grille) fixed. Finally, the overall effectiveness of the UV-C system combined with the ventilation effectiveness for cases was evaluated by using a newly developed Spread Index method.
Virtual office space
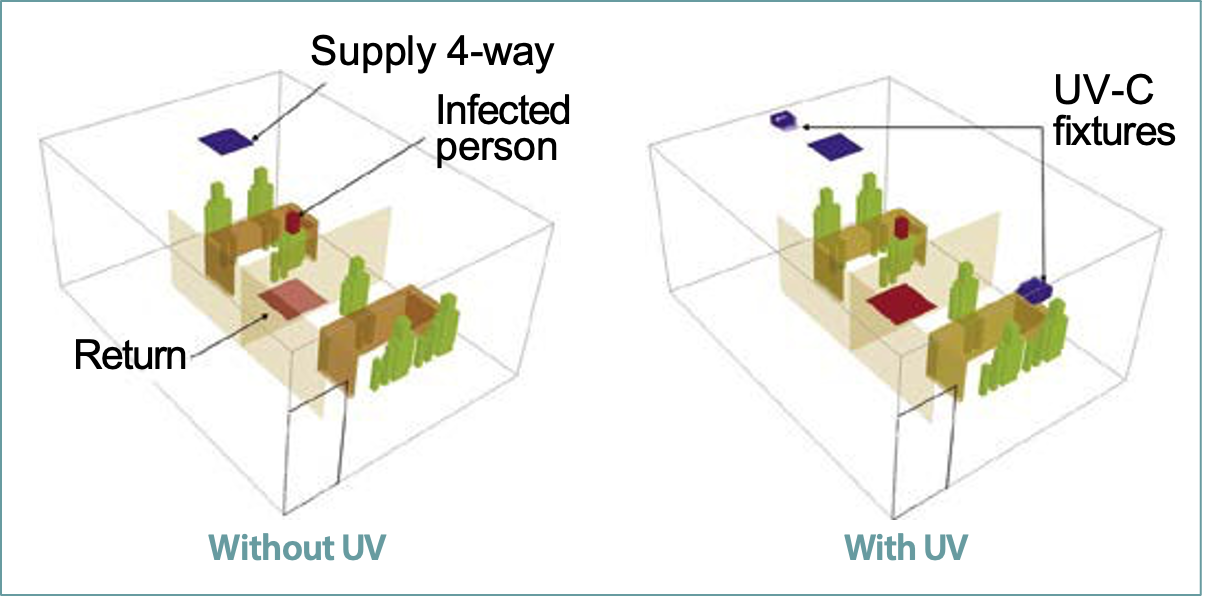
Three-dimensional, steady state, isothermal CFD models for a typical small office space with two cubicles were developed. The space had a total floor area (including the corridor) of about 27.9m² with 2.74m ceiling height and an occupancy of 6 persons. As shown in Figure 1, the cubicles are separated by 1.5m tall dividing partitions. The area of each cubicle was approximately 9.3 m². There was a common corridor adjacent to these cubicles leading to the room door. Each cubicle has three occupants seating around a table. In Figure 1, an infected individual is facing the two other individuals located in a cubicle away from the door. The office space is designed for a supply airflow flow rate of 63.7L/s or 3 air changes per hour (ACH), which corresponds to the total cooling load of 879 W for a 20 degree difference between the supply and return air temperature.
Two CFD models of the office space were developed: one without UVGI and one with two UV-C fixtures for identical office spaces (Figure 1). These fixtures are placed on the opposite walls along the long side of the room. The two UV-C fixtures are assumed to generate equal UV-C output. The UV-C fixtures are equipped with the extended baffles that direct the UV-C radiation perpendicular to the fixture.
The k-ω turbulence model was employed to compute the turbulent viscosity of the air. A computational mesh of about 0.75 million hexahedral cells was created by placing fine mesh near the strategic locations. The infectious aerosol release from an infected person is simulated as a continuous tracer gas emission. The ventilation performance of each configuration is evaluated using the Spread Index as described below. The probability of infection evaluated using the Wells-Riley correlation is also described. The mean age of air is computed by solving the passive scalar transport equation.6
The UV-C distribution in the range of 254nm was computed using the discrete ordinates (DO) radiation model. The reflectivity of UV-C radiation from walls is assumed to be 0.05. The UV-C dose (D, J/m²) is computed by multiplying the UV-C intensity (W/m²) with the mean age of air (s). The UV-C effectiveness (η) is computed using the following equations: 1, 3
η = 1−S (1a)
S = e−kD (1b)
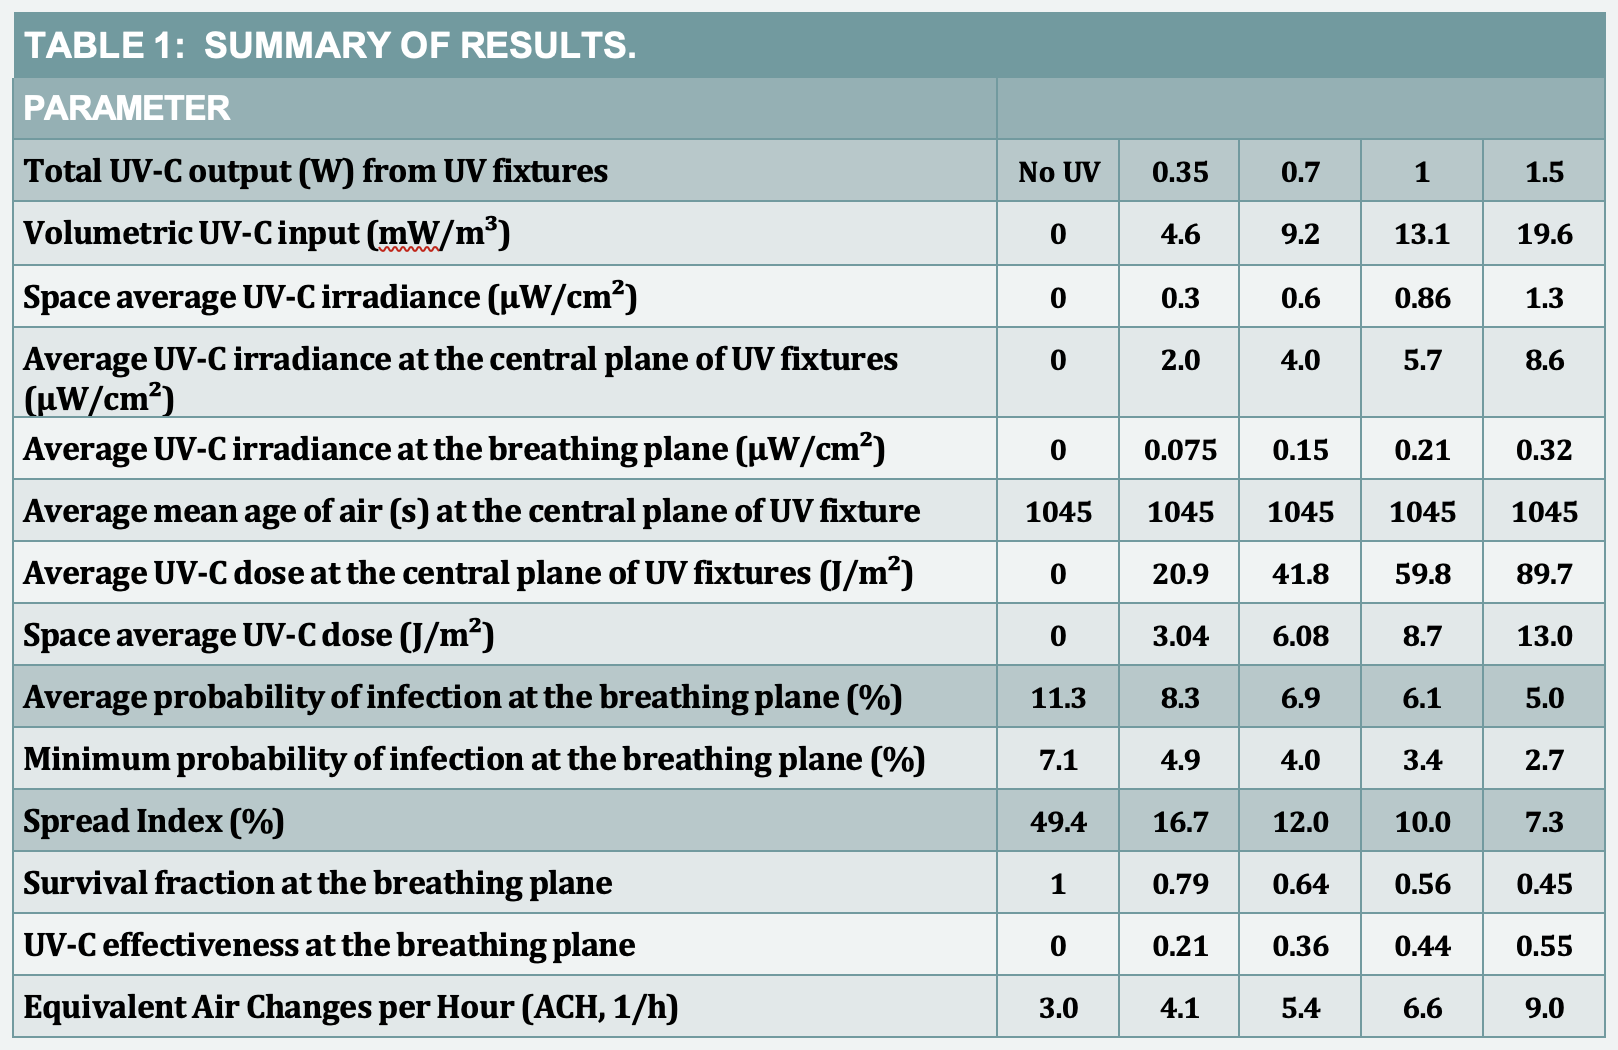
Where S is a survival fraction – a ratio of the microbial population with and without UV-C and k is a species dependent inactivation rate constant (m²/J). The species is assumed to be the SARS-CoV-2 virus with a k value of 0.08528m²/J, which is based on the average of rate constant data available at the time this study was performed.2,7 The transport of virus is computed as a scalar variable. This value was used in all simulations. As the virus is transported through various locations in the space, it experiences a cumulative inactivation as it passes through the zones of spatially distributed dose. As shown in Table 1, a total of four analyses were performed for the UV-C output varying from 0.35 to 1.5W that corresponds to volumetric UV-C intensity of 4.6 to 19.6 (mW/m³).
Spread Index (SI)TC
Ventilation performance for each case was analyzed using the Spread Index, which is the ratio of the volume of the space occupied by the infection risk level above a certain value to the total volume of the space.8 Ideally, the ventilation systems should minimize the spread of contaminants and reduce the probability of infection everywhere in the space. Assuming the target concentration is a safe exposure limit, the ideal (SI)TC should always be close to zero. It should be noted that the safe level of concentrations can depend on several risk factors including the type and quantities of contaminants or pathogens in the space and their safe exposure limits. Therefore, for each space, (SI)TC can be evaluated for various levels of target concentrations and infection levels based on the exposure risk. The UV-C dose, design of an HVAC system and the resulting flow path of airborne contaminants play an important role in determining the (SI)TC levels in a space.
The Spread Index provides a normalized comparison of UVGI and ventilation effectiveness for various cases. In this study, the Spread Index of the probability of infection was set arbitrarily at 10%, and hence, (SI)10 is evaluated.
Probability of infection
Infection risk assessment was performed by employing the Wells-Riley model, which has been extensively used for quantitative infection risk assessment of respiratory infectious diseases in indoor spaces.2, 9 This model stated in Equation 2 considers the intake dose of airborne pathogens in terms of the number of infectious quanta (dose that will cause an infection in 63% of a susceptible population) to evaluate the probability of infection:
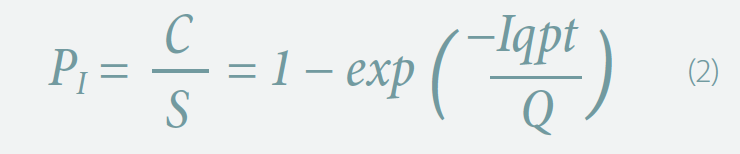
where PI is the probability of infection that is a ratio of the number of infection cases to the number of susceptible, I is the number of infectors, p is the pulmonary ventilation rate of a person, q is the quanta generation rate per infector, t is the exposure time interval, and Q is the room ventilation rate with clean air. This model assumes well mixed conditions and predicts a single number for the infection probability for an entire indoor space, and thus, ignores the spatial and temporal variations of pathogen concentration in a space. The present study demonstrates that the risk of infection depends on the location of occupants and HVAC configuration of the space.
In the present work, the number of infectors (I) was assumed to be one and the exposure time (t) was assumed to be one hour. The quanta generation rate for influenza varies from 2 to 128 quanta per hour.
The q value of 60 quanta per hour is assumed, which is most frequently used in the ventilation analysis.5, 10 The release of quanta is assumed to be continuous, and transient events like coughing or sneezing are not part of these analyses.
Results and discussion
Airflow patterns
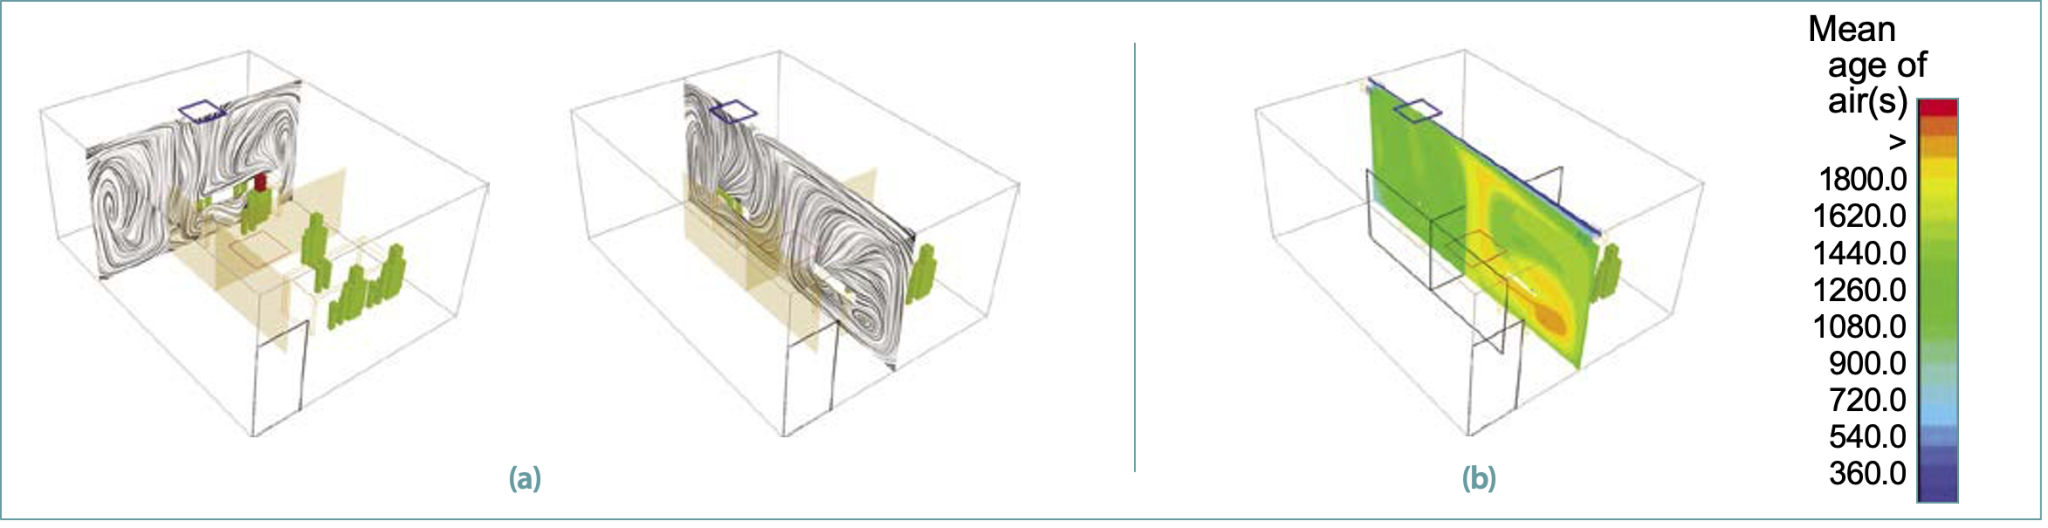
Figure 2a shows the airflow patterns in the space in two orthogonal vertical planes passing through the center of a supply diffuser. The air exiting the diffuser travels along the ceiling, descends along the walls and moves inward along the floor away from the walls. Such airflow patterns create large recirculation loops along and across the room.
These large recirculation zones form inside the cubicles between the room walls and the dividing partitions in the occupied zone. Three-dimensional airflow patterns (not shown here) are quite complex and promote mixing in the entire space as expected from such diffusers.
Figure 2b shows the resulting distribution of the mean age of air[s] at the center plane. Under ideal conditions for a single pass flow, for the 3 air changes per hour (h-1) supply airflow rate, the average mean age of air should be 1200s. However, recirculation zones, which also promote stagnant zones, cause nonuniform distribution of the mean age of air. The large air recirculation zones in the second cubicle, which was close to the door, form a stagnation zone in which the mean age of air is higher than the average value.
Higher values of the mean age of air can increase the residence time of the airborne pathogens, which in turn can result in a higher dose of UV-C.
Distribution of UV-C intensity and dose
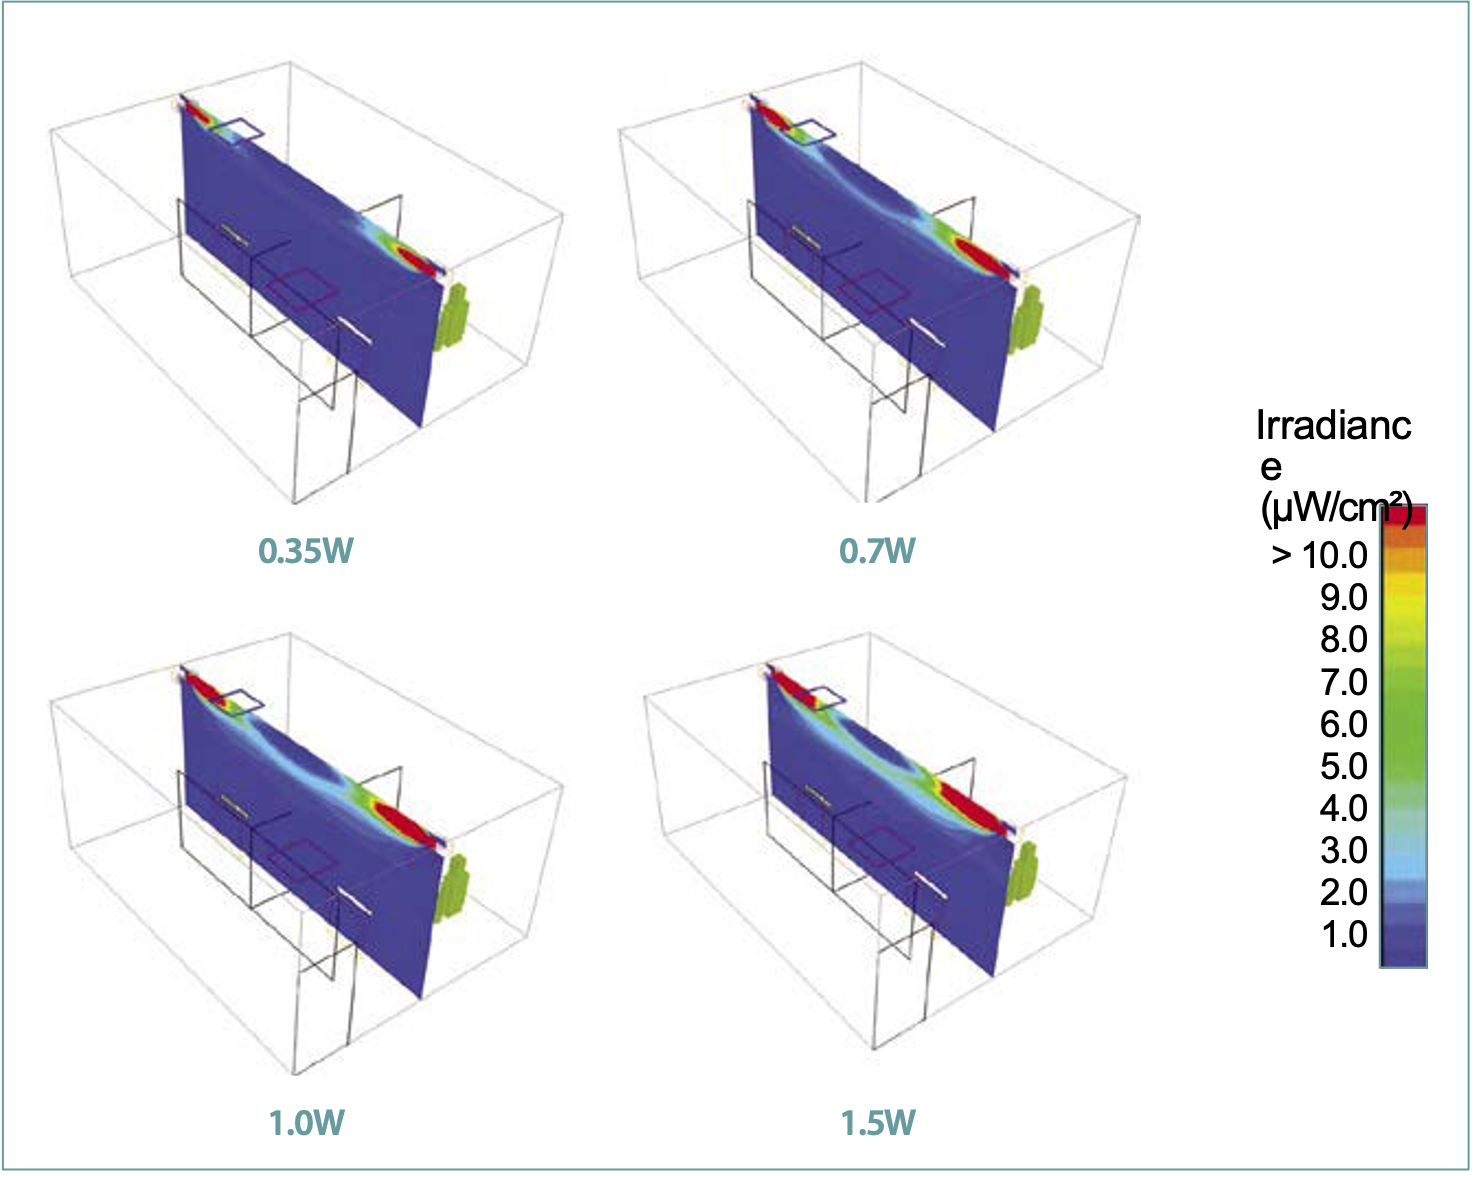
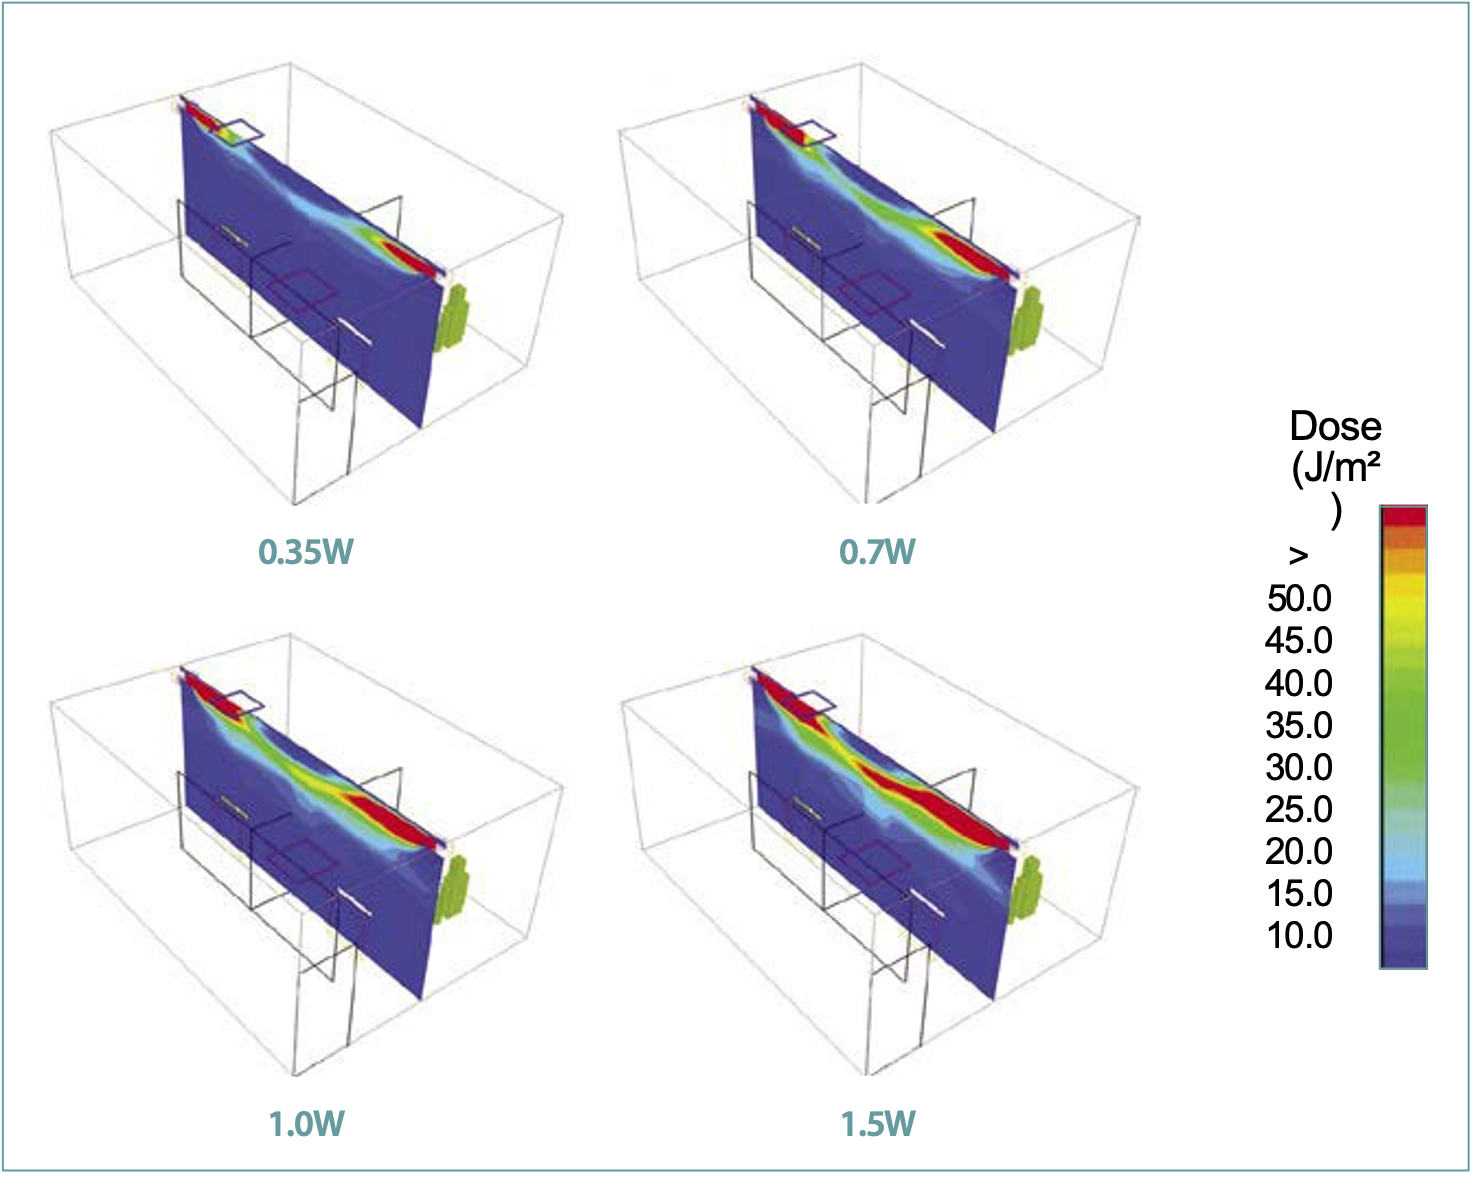
Figure 3 shows the distribution of UV-C irradiance at the central plane along the long side of the room for various UV-C outputs. As shown in Figure 3, the highest UV-C intensity occurred close to the fixtures and gradually reduced toward the center of the room. Since only 5% of the UV-C radiation was reflected and the ceiling and walls absorbed the remaining 95%, the UV-C irradiance reduced as it traveled away from the fixtures. Figure 3 also shows that the extent of high-intensity zones increased in both the inward and the downward directions, with an increase in the UV-C output. However, it should be noted that in all the cases, the high-intensity zone did not reach the center of the room and a low-intensity zone was formed near the ceiling. Figure 4 shows the resulting distribution of UV-C dose at the central plane along the long side of the room for various UV-C outputs. As noted before, the UV-C dose was computed by multiplying the UV-C irradiance with the mean age of air. As a result, the dose distribution shows the impact of both the UV-C intensity and the mean age of air. Since the mean age of air was higher in the second cubicle, the zone of high UV-C dose showed larger spread in the second cubicle.
Similar to the UV-C intensity, the UV-C dose was highest in the vicinity of the fixtures and gradually reduced toward the center of the room. It should be noted that the mean age of the clean air was at the lowest value as it exited from the supply diffuser and traveled along the ceiling, and therefore, the resulting dose along the path of the clean air showed a similar trend. It should be noted that it is not just the UV-C intensity, but the residence time of the pathogens through the high-intensity zone that determined the efficacy of the upper room UVGI systems. Also, the airflow patterns and UV-C intensity distribution are mutually independent and do not impact their respective distribution in the space.
Table 1 shows the average irradiance and the resulting dose values for the entire space and at the horizontal planes at 1.37m (breathing plane) and 2.59m (central plane through the fixtures) from the floor. Since the UV-C reflectivity of all surfaces is assumed to be the same, the average values of irradiance shows a linear relationship with the UV-C output. Since the average irradiance at the breathing plane (1.37m from the floor) increases with UV-C output, caution should be exercised to avoid human exposure beyond the safe acceptable limits.
Probability of infection and Spread Index
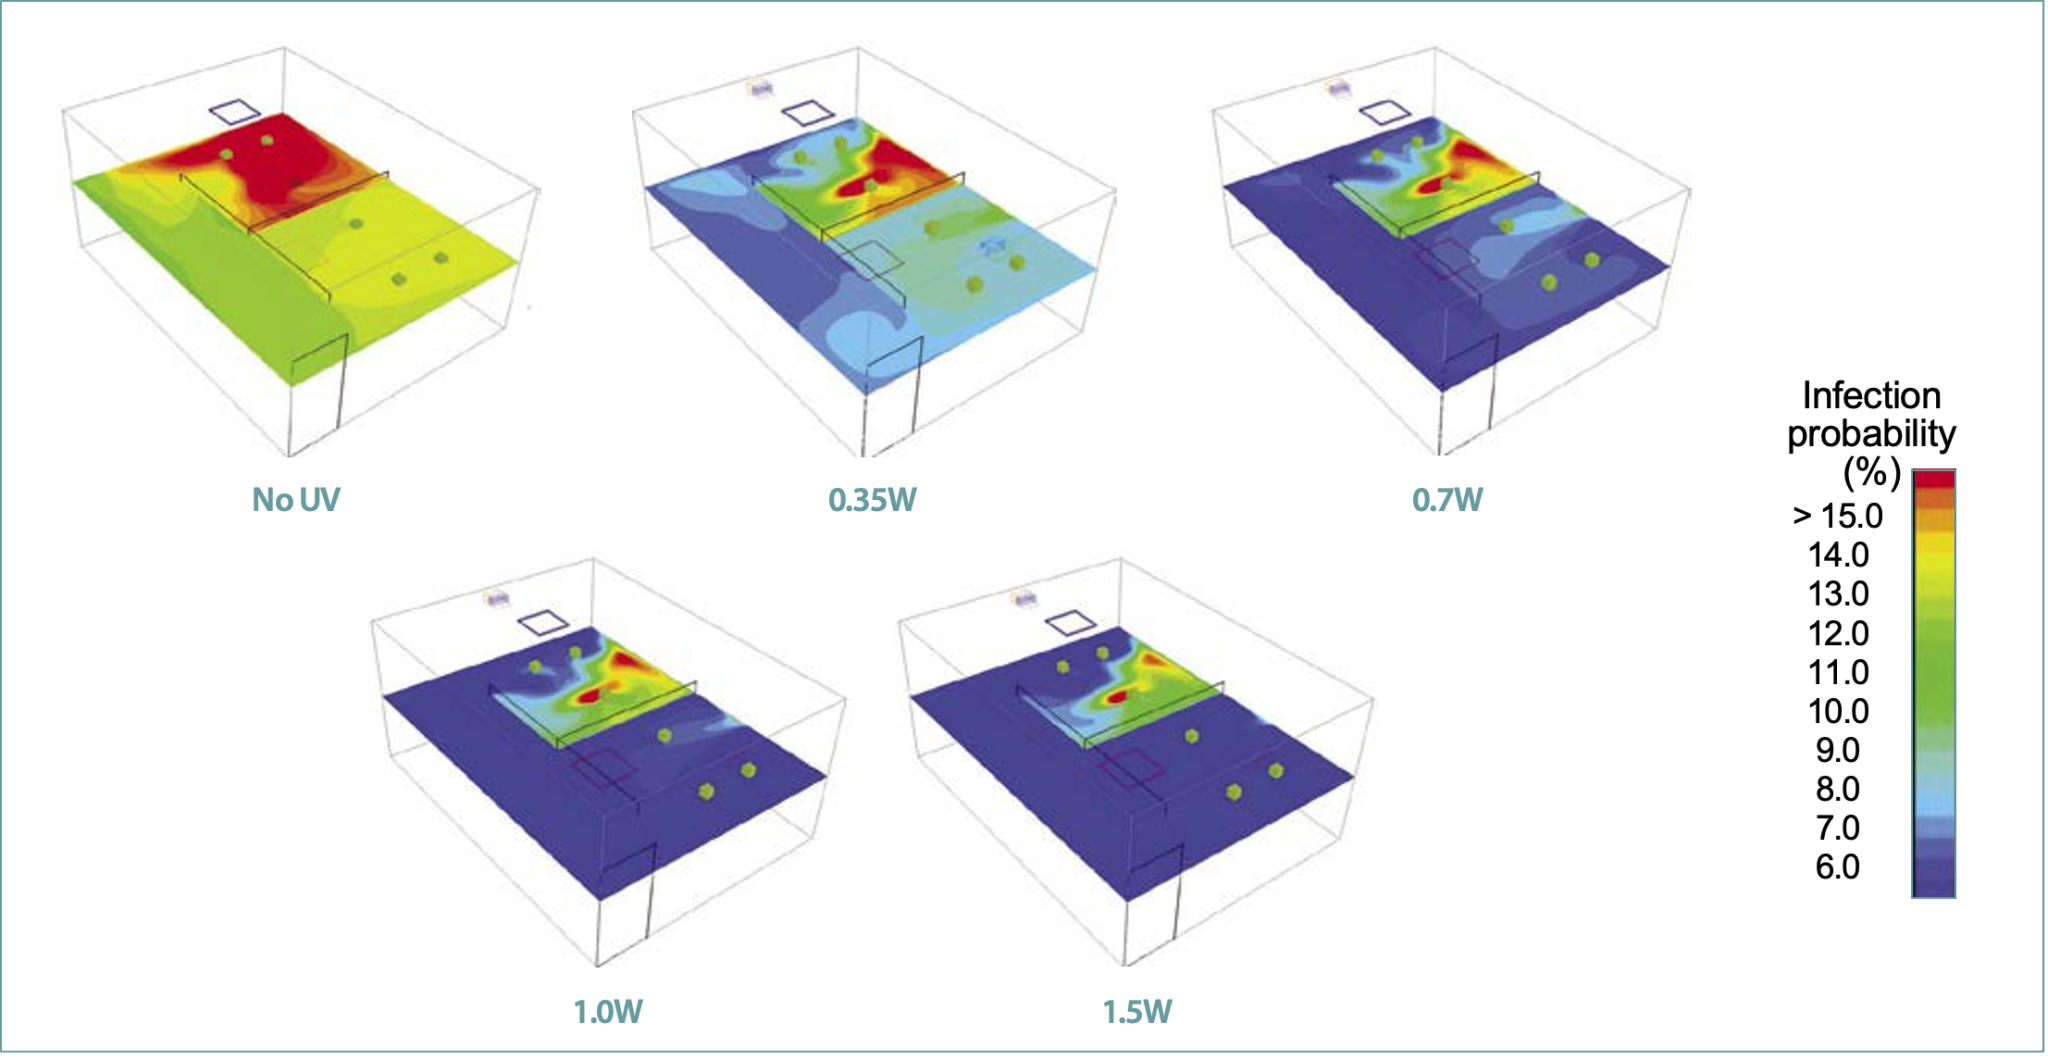
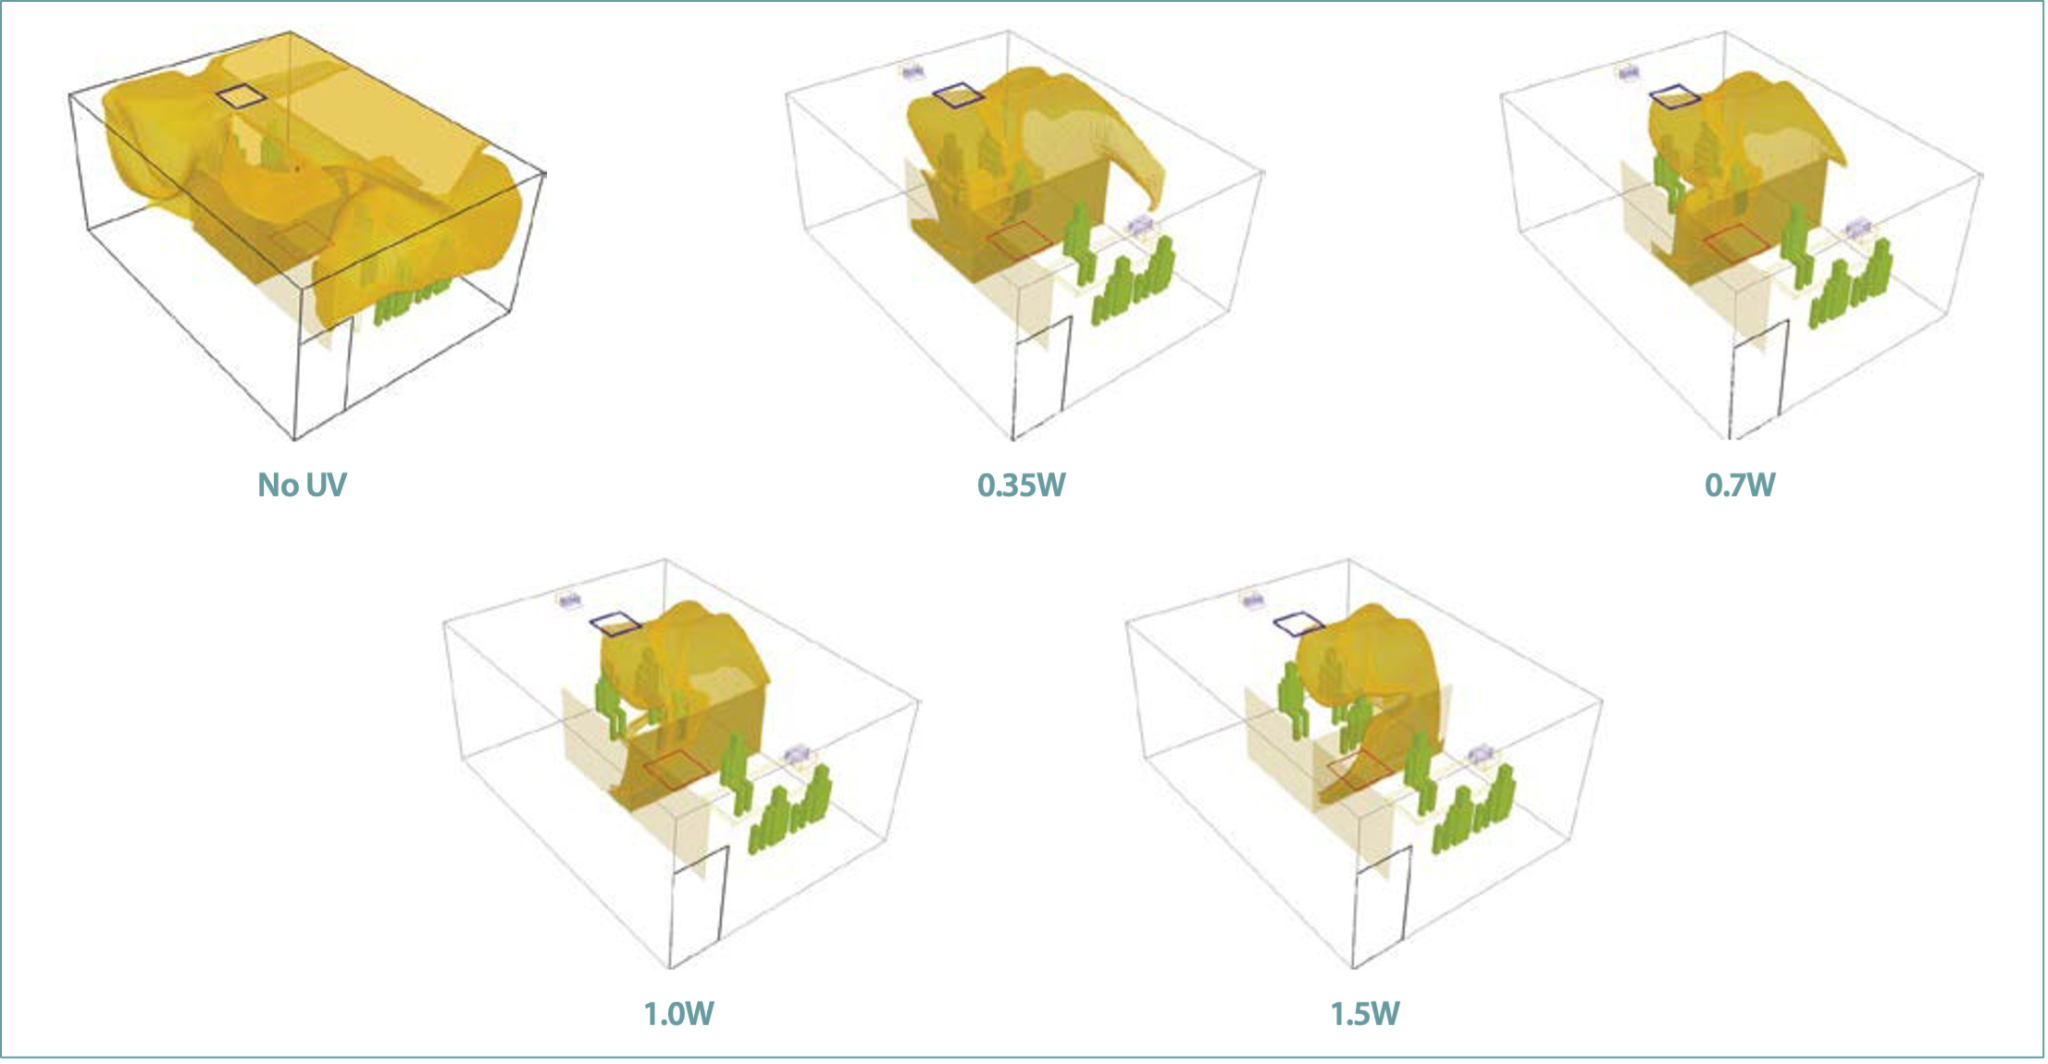
Figures 5 and 6, respectively, show the resulting risk of infection computed per Equation 2 at a breathing level and the extent of infection spread in the space above 10% probability.
For the case of no UV, the airflow patterns described above create a non-uniform distribution of contaminant concentration with a zone of high infection probability in the vicinity of the infected person. The lowest concentration was in the adjacent corridor. The stagnation of the air in the recirculation zones promoted the accumulation of contaminants. The Spread Index (SI)10 was 49.4%, indicating that about half of the room space is at or above 10% probability of infection. The zones of high and low risk of infection divide the space along the length of the room. As shown in Figures 5 and 6, by adding the upper room UV-C, the risk of infection and the resulting Spread Index (SI)10 reduced significantly with an increase in UV-C output.
As shown in Table 1, with a small addition of 0.35W UV-C, the average probability of infection at the breathing plane reduced from 11.3 to 8.3% (a reduction of about 27%). Likewise, the Spread Index (SI)10 reduced from 49.3 to 16.7%, with the zone of high infection shrinking to only the vicinity of an infected individual. As shown in Table 1 with the increase in the UV-C output, the average risk of infection in the breathing plane reduced from 8.3 to 5% (a reduction of about 40%) and the Spread Index (SI)10 reduced from 16.7 to 7.3%.
Similarly, the survival fraction reduced from 0.79 to 0.45, with the corresponding increase in the UV-C effectiveness. Table 1 shows that the effective gain in the equivalent air changes increases from 3ACH to 9ACH at the UV-C output of 1.5W. It should be noted that all simulations were performed for 3ACH. Unlike UV-C irradiance and UV-C dose, reduction in risk is not linear. The net impact of increased UV-C dose on the reduction in infection probability decreases with increasing the UV-C output. Increasing the UV-C input by 54% (from 13 to 20mW/ m³), the average survival fraction reduced by about 20% (from 0.56 to 0.45). This is due to the exponential decay relationship between the survival fraction and the UV-C dose as shown by Equation 1b.
It should be noted that the airflow patterns and the resulting mean age of air remained the same in all the cases. This could be a limiting factor in improving the UV-C performance. Modifications in the locations and number of supply and returns diffusers might help in increasing the residence time of pathogens in the UV-C zone. It should be noted that the infection risk cannot be reduced to zero, which is practically not possible for indoor spaces without effective source control strategies.
Conclusion
The wavelength band of 200–280nm of UV-C radiation can destroy the reproduction ability of microorganisms including viruses, bacteria and fungi. The UV-C dose, which is the product of the UV-C irradiance and the residence time of the microbes in the UV-C field, is the most crucial factor affecting the efficacy of upper-room UVGI systems. Several factors related to the UV fixtures, HVAC layout and the resulting airflow flow patterns can affect the performance of upper-room UVGI applications. Using CFD analyses, this work systematically evaluated the impact of UV-C intensities on the effectiveness of an upper room UVGI system. It demonstrated that with the addition of a small UV-C output (about 5mW/m³), the average probability of infection due to airborne pathogens can be reduced by 27% and limit the spread of infection probability only in the vicinity of an infected individual. Increasing the UV-C output showed a further reduction in the infection probability with a diminishing impact on the survival fraction of the pathogens. Increasing the UV-C input by 54% (from 13 to 20mW/m³), the average survival fraction of pathogens reduced by about 20% (from 0.56 to 0.45).
This study also indicates that increasing the UV-C output can increase the average irradiance in the occupied zone and potentially reach the unsafe limit. The present study was performed with the same HVAC configuration using a single 4-way supply diffuser and a single return grille, which could have limited the residence time of airborne pathogens in the upper room zone of high UV-C intensity. The second part of this study will evaluate the impact of airflow patterns on the performance of UVGI systems. This work demonstrates that CFD analyses can help optimize the performance of UVGI systems and minimize the probability of infection in indoor spaces.
©ASHRAE www.ashrae.org. Used with permission from ASHRAE Journal. This article may not be copied nor distributed in either paper or digital form without ASHRAE’s permission. For more information about ASHRAE, visit www.ashrae.org.
Acknowledgements
The authors are thankful to Mr. Thierry Marchal, Ansys, for providing software support for the study.

This article appears in Ecolibrium’s Spring 2023 edition
View the archive of previous editions


Latest edition
See everything from the latest edition of Ecolibrium, AIRAH’s official journal.